
Figures & data
Table 1. Selected characteristics of WEB study cases by inclusion in methylation analysesFootnotea.
Figure 1. Distribution of average percent DNA methylation in breast tumors, selected genes, WEB study. The distance between the 25th and 75th percentiles, the inter-quartile range, is represented by the length of the box. The vertical lines represent 1.5 times the 25th and 75th percentile. The symbols outside the vertical lines represent values outside 1.5 times the inter-quartile range. The mean is represented by the symbol within the box and the median by the horizontal line within the box.
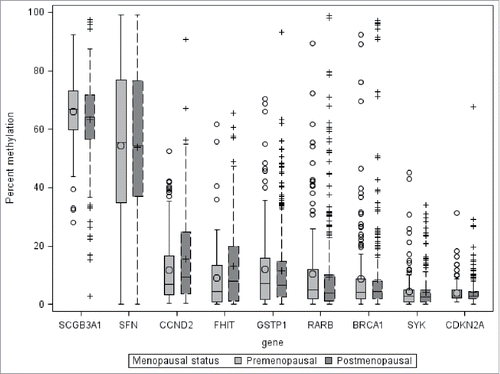
Table 2. Association of methylation above the median for selected genes with selected clinicopathological factors for breast cancer, premenopausal women WEB study 1996–2001.
Table 3. Association of methylation above the median for selected genes with selected clinicopathological factors for breast cancer, postmenopausal women WEB study 1996–2001.
Table 4. Hazard ratios (HR) and 95% confidence intervals (CI) for death from breast cancer by methylation of selected genes, WEB study premenopausal cases of breast cancer.
Table 5. Hazard ratios (HR) and 95% confidence intervals (CI) for death from breast cancer by methylation of selected genes, WEB study postmenopausal cases of invasive breast cancer.
Table 6. Summary of functions of genes included in analysis.