3,539
Views
55
CrossRef citations to date
0
Altmetric
Research Paper

Epigenetic dysregulation in the developing Down syndrome cortex

, , , , , , , , , & show all
Pages 563-578 | Received 11 Mar 2016, Accepted 17 May 2016, Published online: 01 Jul 2016

Figures & data

Figure 1. Plot of methylation changes (β differences) along the distribution of mean methylation levels (range of β values). Only significant changes (adjusted P < 0.05) were considered. The lowess smoother (red line) reveals hypermethylation of all chromosomes except chromosome 21 with a maximum change in the middle range of β values. The changes on chromosome 21 are balanced between hyper- and hypo-methylation with stronger signal toward extreme β values. The methylation data underlying this figure were normalized using the SWAN method; however, the observed genome-wide hypermethylation of all chromosomes except 21 remained stable under various normalization procedures (data not shown).
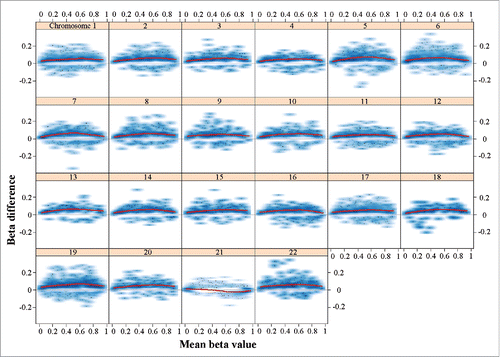
Figure 1. Plot of methylation changes (β differences) along the distribution of mean methylation levels (range of β values). Only significant changes (adjusted P < 0.05) were considered. The lowess smoother (red line) reveals hypermethylation of all chromosomes except chromosome 21 with a maximum change in the middle range of β values. The changes on chromosome 21 are balanced between hyper- and hypo-methylation with stronger signal toward extreme β values. The methylation data underlying this figure were normalized using the SWAN method; however, the observed genome-wide hypermethylation of all chromosomes except 21 remained stable under various normalization procedures (data not shown).

Figure 2. DNA methylation age in fetal DS brain. DS fetal cortices are indicated by red and control samples by blue dots. The gestational age of frontal, temporal and all cortex samples is positively correlated with DNA methylation age. The regression lines suggest accelerated DNA methylation aging in DS versus control brains.
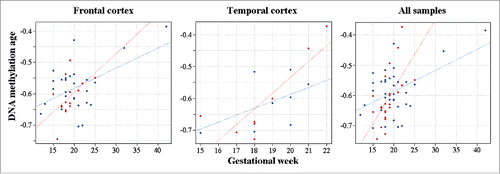
Figure 2. DNA methylation age in fetal DS brain. DS fetal cortices are indicated by red and control samples by blue dots. The gestational age of frontal, temporal and all cortex samples is positively correlated with DNA methylation age. The regression lines suggest accelerated DNA methylation aging in DS versus control brains.

Figure 3. Chromosomal localization of differentially methylated promoters. Blue dots represent methylation β differences of 15,490 promoters (with >3 CpG sites on the array) between DS and control cortices. Promoters are mapped to their chromosomal position. Red dots represent the top 100 ranked differentially methylated promoters.
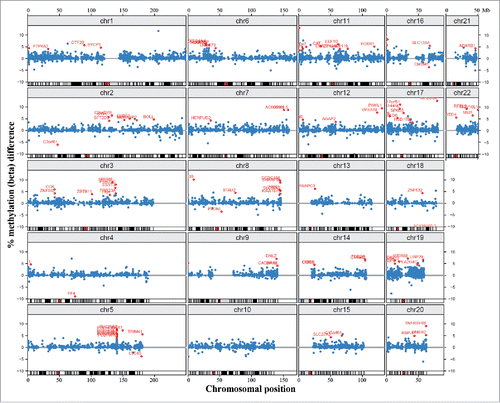
Figure 3. Chromosomal localization of differentially methylated promoters. Blue dots represent methylation β differences of 15,490 promoters (with >3 CpG sites on the array) between DS and control cortices. Promoters are mapped to their chromosomal position. Red dots represent the top 100 ranked differentially methylated promoters.

Figure 4. Differential methylation of CPT1B and CELSR3. Red dots represent the methylation level of individual CpGs in DS cortex samples; the blue dots represent control samples. Light blue bars indicate transcribed sequence and orange bars CpG islands.
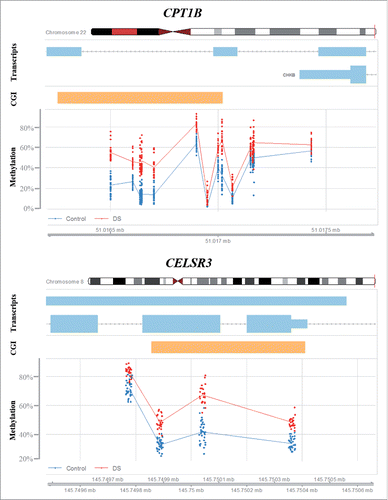
Figure 4. Differential methylation of CPT1B and CELSR3. Red dots represent the methylation level of individual CpGs in DS cortex samples; the blue dots represent control samples. Light blue bars indicate transcribed sequence and orange bars CpG islands.

Table 1. Genes with at least 3 significant CpG sites (β difference > 0.1).

Figure 5. Differential methylation of the PCDHG gene cluster in DS brain. The upper part shows the genomic organization of the PCDHG gene cluster with exons depicted in orange. The bottom diagrams represent methylation β differences between DS and control samples and average methylation (of all samples) in fetal and adult frontal cortices. Significant methylation differences are indicated by red, non-significant changes by blue bars. Differential methylation is restricted to genes of the A and B but not the C subfamilies and very similar in fetal and adult brains.
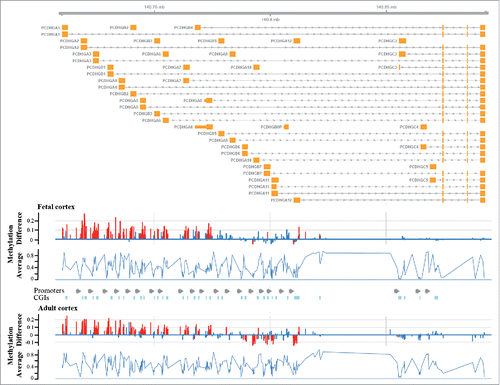
Figure 5. Differential methylation of the PCDHG gene cluster in DS brain. The upper part shows the genomic organization of the PCDHG gene cluster with exons depicted in orange. The bottom diagrams represent methylation β differences between DS and control samples and average methylation (of all samples) in fetal and adult frontal cortices. Significant methylation differences are indicated by red, non-significant changes by blue bars. Differential methylation is restricted to genes of the A and B but not the C subfamilies and very similar in fetal and adult brains.

Figure 6. Hypermethylation and expression changes of PCDHG genes and CELSR3 in DS brain. Methylation was measured by bisulfite pyrosequencing. Each dot represents the mean methylation level of one individual DS or control fetal frontal cortex. Expression was measured by targeted RNA sequencing. Blue lines compare median methylation and expression, respectively, between DS and control fetal frontal cortices.
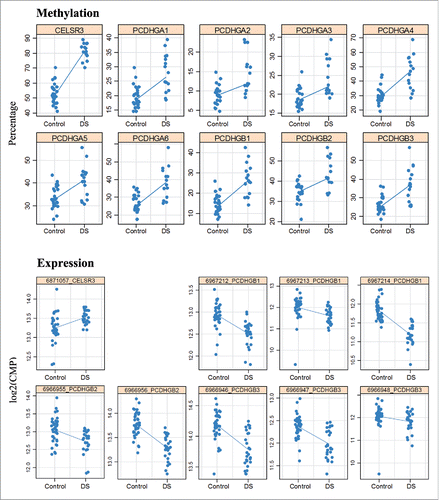
Figure 6. Hypermethylation and expression changes of PCDHG genes and CELSR3 in DS brain. Methylation was measured by bisulfite pyrosequencing. Each dot represents the mean methylation level of one individual DS or control fetal frontal cortex. Expression was measured by targeted RNA sequencing. Blue lines compare median methylation and expression, respectively, between DS and control fetal frontal cortices.

Table 2. Expression differences of PCDHG and other genes between DS and control frontal cortex.

Supplemental material

Supplemental_Data.doc

Download MS Word (2.1 MB)