3,587
Views
60
CrossRef citations to date
0
Altmetric
Research Paper

Epigenome-wide differential DNA methylation between HIV-infected and uninfected individuals

, , , , , , , , , & show all
Pages 750-760 | Received 22 Apr 2016, Accepted 02 Aug 2016, Published online: 27 Sep 2016

Figures & data

Figure 1. Effect of cell composition on DNA methylation. Volcano plots show the coefficient at a CpG site vs. -log10(P-value). Blue circles indicate hypomethylated CpG sites, while red circles indicate hypermethylated CpG sites. (A) Volcano plot showing association results without correction for cell types. (B) Volcano plot with correction for 6 cell types in the blood.
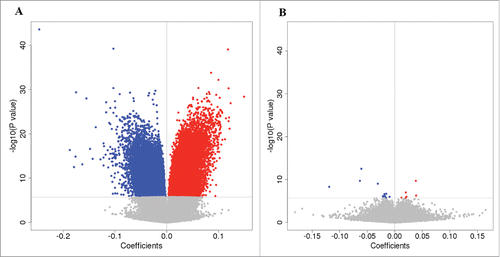
Figure 1. Effect of cell composition on DNA methylation. Volcano plots show the coefficient at a CpG site vs. -log10(P-value). Blue circles indicate hypomethylated CpG sites, while red circles indicate hypermethylated CpG sites. (A) Volcano plot showing association results without correction for cell types. (B) Volcano plot with correction for 6 cell types in the blood.

Figure 2. Epigenome-wide association analysis of 437,722 CpG sites in 378 samples. A. Manhattan plot showing chromosome location of 22 autosomes (X-axis) and –log10(P-value) for each CpG (Y-axis). Blue line indicates the threshold for significance (FDR q < 0.05). Red line indicates the significance level after Bonferroni correction (Padj < 0.05). Two CpG sites in the promoter of NLRC5 on chromosome 16 reached epigenome-wide significance (cg07839457: P = 4.96E-09; cg16411857: P = 2.01E-10). B. Quantile-quantile plot showing observed vs. expected –log10(P-value) for association at all CpG sites (λ = 1.17). A regression model was applied for EWAS, adjusted for batch, cell types, and other clinical confounding factors.
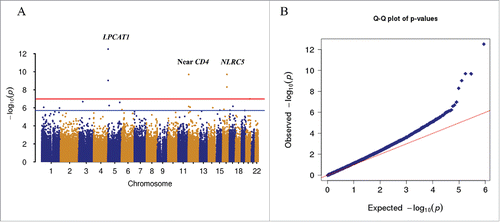
Figure 2. Epigenome-wide association analysis of 437,722 CpG sites in 378 samples. A. Manhattan plot showing chromosome location of 22 autosomes (X-axis) and –log10(P-value) for each CpG (Y-axis). Blue line indicates the threshold for significance (FDR q < 0.05). Red line indicates the significance level after Bonferroni correction (Padj < 0.05). Two CpG sites in the promoter of NLRC5 on chromosome 16 reached epigenome-wide significance (cg07839457: P = 4.96E-09; cg16411857: P = 2.01E-10). B. Quantile-quantile plot showing observed vs. expected –log10(P-value) for association at all CpG sites (λ = 1.17). A regression model was applied for EWAS, adjusted for batch, cell types, and other clinical confounding factors.

Figure 3. Epigenome-wide significant differences at 14 CpG sites. A. Box plots of methylation β values for 14 significant CpG sites with average methylation difference greater than 5% between HIV-infected and uninfected individuals. B. Log2 value of fold-changes for 14 significant CpG sites in HIV-infected vs. HIV-uninfected patients.
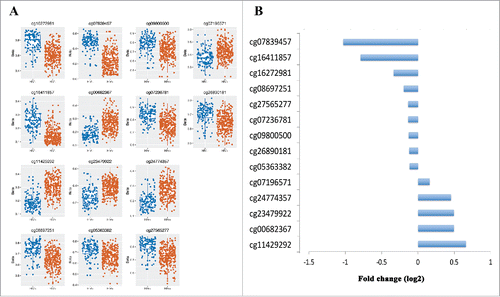
Figure 3. Epigenome-wide significant differences at 14 CpG sites. A. Box plots of methylation β values for 14 significant CpG sites with average methylation difference greater than 5% between HIV-infected and uninfected individuals. B. Log2 value of fold-changes for 14 significant CpG sites in HIV-infected vs. HIV-uninfected patients.

Table 1. Epigenome-wide association analysis identified 20 CpG sites for HIV infection in the Veteran Aging Cohort Study.

Figure 4. DNA methylation in NLRC5 were associated with HIV infection in 2 independent data sets. A. Regional Manhattan plot of DNA methylation association analysis with HIV infection on chromosome 16, gene structure of NLRC5, and methylation level of 21 CpG sites in NLRC5 between HIV-infected and uninfected groups in the Veteran Aging Cohort Study (VACS). B. Methylation distributions of cg07839457 and cg16411857 in HIV-infected patients and uninfected patients in the VACS sample. C. Methylation level of 21 CpG sites in NLRC5 between HIV-infected and uninfected groups in the public dataset GSE66705. D. Methylation distributions of cg07839457 and cg16411857 in HIV-infected patients and uninfected patients in GSE66705.
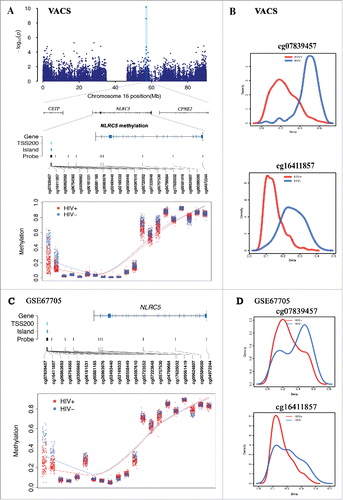
Figure 4. DNA methylation in NLRC5 were associated with HIV infection in 2 independent data sets. A. Regional Manhattan plot of DNA methylation association analysis with HIV infection on chromosome 16, gene structure of NLRC5, and methylation level of 21 CpG sites in NLRC5 between HIV-infected and uninfected groups in the Veteran Aging Cohort Study (VACS). B. Methylation distributions of cg07839457 and cg16411857 in HIV-infected patients and uninfected patients in the VACS sample. C. Methylation level of 21 CpG sites in NLRC5 between HIV-infected and uninfected groups in the public dataset GSE66705. D. Methylation distributions of cg07839457 and cg16411857 in HIV-infected patients and uninfected patients in GSE66705.

Figure 5. Correlation between methylation levels of cg07839457 and cg16411857 in NLRC5 and HIV-1 viral load in the 2 independent samples. Negative correlation with HIV-1 viral load in HIV-infected individuals (VL > 75) (r2 = 0.13, P = 1.8 × 10⁻⁴ for cg07839457 and r2 = 0.04, P = 0.03 for cg16411857) in the VACS (A) and in an independent publicly available sample (GSE53840) (VL > 75) (r2 = 0.18, P = 0.04 for cg07839457 and r2 = 0.15, P = 0.01 for cg16411857) (B).
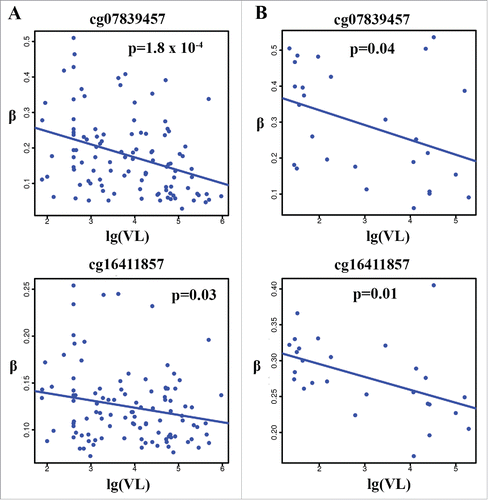
Figure 5. Correlation between methylation levels of cg07839457 and cg16411857 in NLRC5 and HIV-1 viral load in the 2 independent samples. Negative correlation with HIV-1 viral load in HIV-infected individuals (VL > 75) (r2 = 0.13, P = 1.8 × 10⁻⁴ for cg07839457 and r2 = 0.04, P = 0.03 for cg16411857) in the VACS (A) and in an independent publicly available sample (GSE53840) (VL > 75) (r2 = 0.18, P = 0.04 for cg07839457 and r2 = 0.15, P = 0.01 for cg16411857) (B).

Table 2. Demographic and clinical characteristics of HIV-infected and HIV-uninfected patients from the Veteran Aging Cohort Study.

Supplemental material

KEPI_A_1221569_supplemental_data.zip

Download Zip (6.8 MB)