872
Views
8
CrossRef citations to date
0
Altmetric
Research Paper

The combination of dimethoxycurcumin with DNA methylation inhibitor enhances gene re-expression of promoter-methylated genes and antagonizes their cytotoxic effect

, , , , , , , , & show all
Pages 740-749 | Received 13 Jul 2016, Accepted 12 Aug 2016, Published online: 01 Nov 2016

Figures & data

Figure 1. Effect of simultaneous treatment with DAC and DMC on apoptosis induction in leukemia cells. a. CEM leukemia cells were treated with different concentrations of DAC, DMC, and the combination for 48 h and apoptosis induction was quantified as described under methods. The left, middle, and right panels: we used 250 nM, 500 nM, and 1000 nM of DAC in combination with different concentrations of DMC, respectively. b. Jurkat leukemia cells were treated with DAC, DMC, and the combination, similar to the treatment to CEM cells. In all experiments, data represent the mean ± SD for 3 replicates. c. Analysis of the synergistic and antagonistic effects of the combination on apoptosis induction. The combination index (CI) was calculated by CalcuSyn software for dose-effect analysis in CEM cells (left panel) and Jurkat cells (right panel). The combinations used were fixed concentrations of DAC with variable concentrations of DMC (250, 500, 1000 nM). d. Analysis of the synergistic and antagonistic effects of the combination on apoptosis induction in BMNC derived from MDS (left panel) and AML patients (right panel). ‘1′ indicates 100 nM DAC + 250 nM DMC, ‘2′ indicates 100 nM DAC + 500 nM DMC, ‘3′ indicates 250 nM DAC + 250 DMC, and ‘4′ indicates 250 nM DAC + 500 nM DMC. CI values equal to 1 are represented by the dashed line and considered additive, values greater than 1 are antagonistic, and values lower than 1 are synergistic.
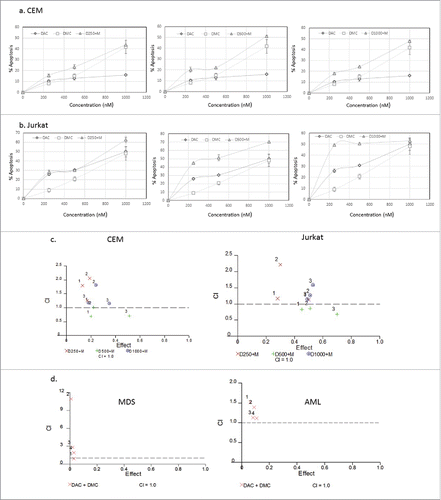
Figure 1. Effect of simultaneous treatment with DAC and DMC on apoptosis induction in leukemia cells. a. CEM leukemia cells were treated with different concentrations of DAC, DMC, and the combination for 48 h and apoptosis induction was quantified as described under methods. The left, middle, and right panels: we used 250 nM, 500 nM, and 1000 nM of DAC in combination with different concentrations of DMC, respectively. b. Jurkat leukemia cells were treated with DAC, DMC, and the combination, similar to the treatment to CEM cells. In all experiments, data represent the mean ± SD for 3 replicates. c. Analysis of the synergistic and antagonistic effects of the combination on apoptosis induction. The combination index (CI) was calculated by CalcuSyn software for dose-effect analysis in CEM cells (left panel) and Jurkat cells (right panel). The combinations used were fixed concentrations of DAC with variable concentrations of DMC (250, 500, 1000 nM). d. Analysis of the synergistic and antagonistic effects of the combination on apoptosis induction in BMNC derived from MDS (left panel) and AML patients (right panel). ‘1′ indicates 100 nM DAC + 250 nM DMC, ‘2′ indicates 100 nM DAC + 500 nM DMC, ‘3′ indicates 250 nM DAC + 250 DMC, and ‘4′ indicates 250 nM DAC + 500 nM DMC. CI values equal to 1 are represented by the dashed line and considered additive, values greater than 1 are antagonistic, and values lower than 1 are synergistic.

Figure 2. The combination therapy represses DNMT isoforms gene expression. CEM and Jurkat cell lines were treated with the single agents and the combination for 48 h followed by RNA extraction and quantitative real time RT-PCR using gene specific primers for the 3 DNMT isoforms DNMT1 (a), DNMT3a (b), and DNMT3b (c). The alphanumeric characters represent the name of the drug and the concentration in nM, where ‘D’ represents DAC and ‘M’ represents DMC. For instance, D100 represents DAC 100 nM and D250 + M500 represents the combination of DAC 250 nM and DMC 500 nM. Data represent the mean ± SD for 3 replicates. d. CEM cells treated with single agents and the combination for 48 h followed by nuclear protein extraction and protein gel blotting.
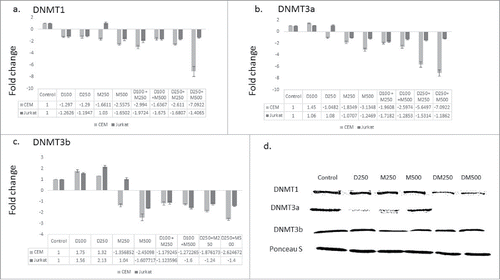
Figure 2. The combination therapy represses DNMT isoforms gene expression. CEM and Jurkat cell lines were treated with the single agents and the combination for 48 h followed by RNA extraction and quantitative real time RT-PCR using gene specific primers for the 3 DNMT isoforms DNMT1 (a), DNMT3a (b), and DNMT3b (c). The alphanumeric characters represent the name of the drug and the concentration in nM, where ‘D’ represents DAC and ‘M’ represents DMC. For instance, D100 represents DAC 100 nM and D250 + M500 represents the combination of DAC 250 nM and DMC 500 nM. Data represent the mean ± SD for 3 replicates. d. CEM cells treated with single agents and the combination for 48 h followed by nuclear protein extraction and protein gel blotting.

Figure 3. The combination of DMC and DAC enhances gene expression of promoter-methylated genes. CEM cells treated with the single drugs and the combination for 24 h and gene expression of p15 (a) and CDH-1 (b) was quantified by RT-PCR as described under Materials and methods. c. BMNC from AML and MDS patients were treated with the single drugs and the combination for 24 h and gene expression of p15 and CDH-1 was quantified. The alphanumeric characters represent the name of the drug and the concentration in nM, where ‘D’ represents DAC and ‘M’ represents DMC. For instance, D100 represents DAC 100 nM and D250 + M500 represents the combination of DAC 250 nM and DMC 500 nM. Data represent the mean ± SD for 3 replicates. * indicates a significant difference from the control at P < 0.05. d. CEM cells treated with the single drugs and the combination for 24 h and the protein expression of p15 and CDH-1 was quantified by Western blotting. D + M250 indicates the combination of 250 nM DAC and 250 nM of DMC. D + M500 indicates the combination of 250 nM DAC and 500 nM DMC.
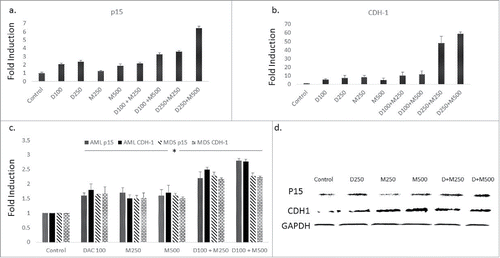
Figure 3. The combination of DMC and DAC enhances gene expression of promoter-methylated genes. CEM cells treated with the single drugs and the combination for 24 h and gene expression of p15 (a) and CDH-1 (b) was quantified by RT-PCR as described under Materials and methods. c. BMNC from AML and MDS patients were treated with the single drugs and the combination for 24 h and gene expression of p15 and CDH-1 was quantified. The alphanumeric characters represent the name of the drug and the concentration in nM, where ‘D’ represents DAC and ‘M’ represents DMC. For instance, D100 represents DAC 100 nM and D250 + M500 represents the combination of DAC 250 nM and DMC 500 nM. Data represent the mean ± SD for 3 replicates. * indicates a significant difference from the control at P < 0.05. d. CEM cells treated with the single drugs and the combination for 24 h and the protein expression of p15 and CDH-1 was quantified by Western blotting. D + M250 indicates the combination of 250 nM DAC and 250 nM of DMC. D + M500 indicates the combination of 250 nM DAC and 500 nM DMC.

Figure 4. DMC does not enhance the hypomethylating activity of DAC. a. CEM cells treated with single drugs, and the combination for 48 h followed by DNA extraction, bisulfite treatment, and DNA pyrosequencing for 7 CpG sites within the CpG island associated with exon 1 of the p15 gene. b. CEM cells treated with single drugs and the combination for 48 h followed by DNA extraction, bisulfite treatment, and DNA pyrosequencing for 5 CpG sites within the CpG island associated with exon 1 of the CDH-1 gene. Data represent the mean ± SD for duplicates. ‘D’ represents DAC, ‘M’ represents DMC, and D250 + M250 indicates the combination of DAC (250 nM) and DMC (250 nM).
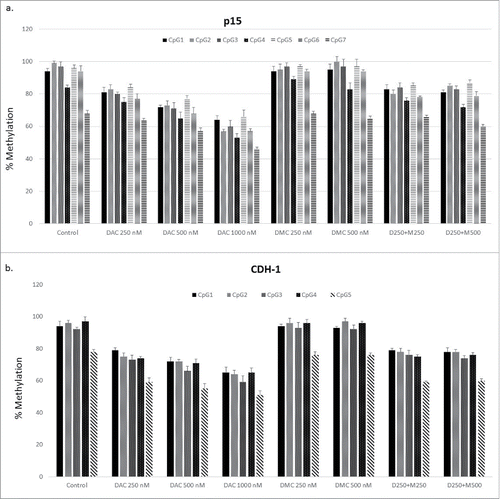
Figure 4. DMC does not enhance the hypomethylating activity of DAC. a. CEM cells treated with single drugs, and the combination for 48 h followed by DNA extraction, bisulfite treatment, and DNA pyrosequencing for 7 CpG sites within the CpG island associated with exon 1 of the p15 gene. b. CEM cells treated with single drugs and the combination for 48 h followed by DNA extraction, bisulfite treatment, and DNA pyrosequencing for 5 CpG sites within the CpG island associated with exon 1 of the CDH-1 gene. Data represent the mean ± SD for duplicates. ‘D’ represents DAC, ‘M’ represents DMC, and D250 + M250 indicates the combination of DAC (250 nM) and DMC (250 nM).

Figure 5. The combination of DAC and DMC increases H3K27 acetylation. ChIP analysis of CEM cells treated with single agents or the combination for 24 h was performed using antibodies against H3K36me3 (a) and H3K27Ac (b) followed by real-time quantitative PCR using primers for p15 and CDH-1. IgG was used as a negative control. DAC 250 indicates 250 nM DAC and DMC 500 indicates 500 nM of DMC. D + M indicates the combination of 250 nM DAC and 500 nM DMC. Data represent the mean ± SD of duplicate ChIP reactions and triplicate PCR reactions. * indicates a significant difference from the control at P < 0.05 and# indicates significant difference from the control and single agents using one way ANOVA followed by Bonferroni post-hoc test.

Figure 5. The combination of DAC and DMC increases H3K27 acetylation. ChIP analysis of CEM cells treated with single agents or the combination for 24 h was performed using antibodies against H3K36me3 (a) and H3K27Ac (b) followed by real-time quantitative PCR using primers for p15 and CDH-1. IgG was used as a negative control. DAC 250 indicates 250 nM DAC and DMC 500 indicates 500 nM of DMC. D + M indicates the combination of 250 nM DAC and 500 nM DMC. Data represent the mean ± SD of duplicate ChIP reactions and triplicate PCR reactions. * indicates a significant difference from the control at P < 0.05 and# indicates significant difference from the control and single agents using one way ANOVA followed by Bonferroni post-hoc test.
Supplemental material

KEPI_A_1226452_s02.pdf

Download PDF (592 KB)

Reprints and Corporate Permissions

Please note: Selecting permissions does not provide access to the full text of the article, please see our help page How do I view content?

To request a reprint or corporate permissions for this article, please click on the relevant link below:

Academic Permissions

Please note: Selecting permissions does not provide access to the full text of the article, please see our help page How do I view content?

Obtain permissions instantly via Rightslink by clicking on the button below:

If you are unable to obtain permissions via Rightslink, please complete and submit this Permissions form. For more information, please visit our Permissions help page.