
Figures & data
Figure 1. MBD sequencing analysis of MYCN non-amplified stage 4S, stage 4, and stage 1/2 tumors identifies stage-specific promoter methylation portraits. A. Diagram of the promoters identified as hypermethylated in the respective sample groups. For example, 393 and 1,150 promoters are specifically hyper- and hypomethylated in stage 4S, respectively. B. Principal component (PC) analysis using the normalized read counts of the promoters included in the diagram. Shown are the data for the first 2 PCs. PC1 explains 29.9% of the variability of the data and PC2 10.1%.
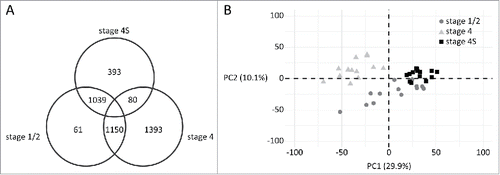
Figure 2. Stage 4S differentially methylated promoters are not randomly distributed across the genome. A. Percentage of stage 4S hypermethylated promoters per chromosome, based on promoter density corrected numbers. Significantly under- and overrepresented chromosomes are indicated with a dark dot. The vertical line represents the percentage if the stage 4S hypermethylated promoters would be randomly distributed across the genome (null hypothesis). B. Percentage of stage 4S hypomethylated promoters per chromosome, based on promoter density corrected numbers. Significantly under- and overrepresented chromosomes are indicated with a dark dot. The vertical line represents the percentage if the stage 4S hypomethylated promoters would be randomly distributed across the genome (null hypothesis). C. Significantly enriched cytogenetic locations of stage 4S hyper- and hypomethylated promoters. A list of genes located in the enriched regions can be found in Supplemental Table 2.
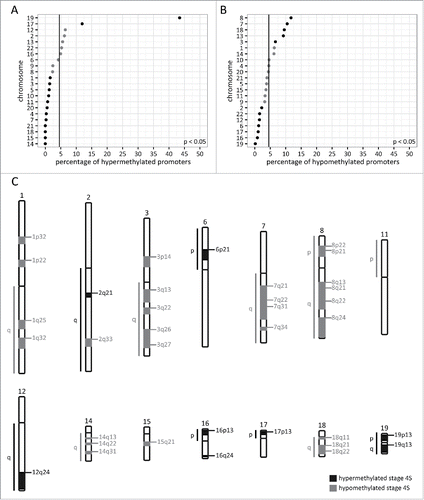
Figure 3. Stage 4S hypermethylated, and stage 4 and 1/2 hypomethylated promoters are frequently located on subtelomeres. Depicted are the percentages of the stage-specific differentially methylated promoters located in the 1 Mb (A) and 2 Mb (B) subtelomeres. Stage 4S hypermethylated and stage 4 hypomethylated promoters have a significantly larger proportion of 1 Mb and 2 Mb subtelomeric promoters, compared to stage 1/2 and stage 4 hypermethylated and stage 4S hypomethylated promoters. Stage 1/2 hypomethylated promoters also comprise a larger proportion of 2 Mb subtelomeric promoters, compared to stage 1/2 and stage 4 hypermethylated and stage 4S hypomethylated promoters.
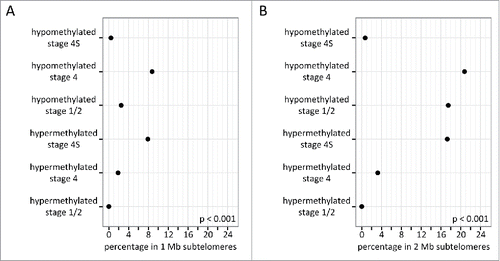
Table 1. One third of subtelomeres are enriched in stage 4S hypermethylated promoters.
Table 2. Specific transcription factor targets are enriched in stage 4S differentially methylated promoters.
Table 3. Oncogenic signatures are enriched in stage 4S hypomethylated promoters.
Table 4. Multiple stage 4S differentially methylated genes are also differentially expressed.