Figures & data
Figure 1. Expression profile of WNT signaling components in adenocarcinoma and squamous cell carcinoma samples. (A-C) Heat map based on the TCGA IlluminaHiSeq mRNA expression platform illustrating the expression signature of WNT pathway genes, including tumor suppressor genes of the SFRP family, membrane receptors of the FZD family, and receptor ligands of the WNT family, clustered into adenocarcinoma subtype (top panel: dark grey) and squamous cell carcinoma subtype (top panel: light grey). Each row represents a specific gene and each column represents a patient sample. The color of each cell indicates the expression value of each gene in that sample: blue (low expression); red (high expression). (D) Box plot analysis of canonical WNT-target gene expression (CCND1, Met, Axin2, CTNNB1) in NSCLC samples subdivided into LUAD and LUSC showing increased canonical target gene expression in primary LUAD samples. Horizontal lines: grouped medians. Boxes: 25–75% quartiles. Vertical lines: range, peak, and minimum. ***P < 0.001. (E) and (F) Representative cartoons of the underlying WNT signaling pathway in LUAD and LUSC based on the expression profile of WNT components and canonical target genes. While a predominant role of canonical WNT signaling might be assumed in LUAD, LUSC were not clearly associated with neither canonical nor non-canonical WNT pathway.
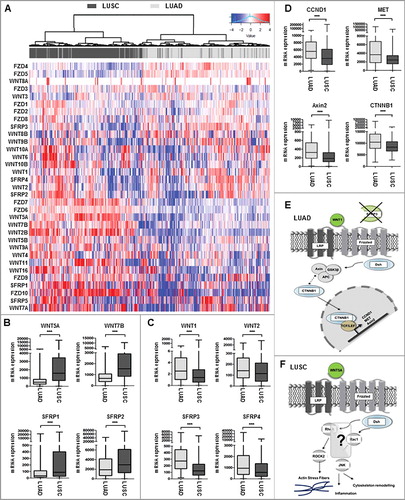
Figure 2. Univariate Kaplan-Meier survival analysis of SFRP3 mRNA expression suggesting a favorable OS and RFS in adenocarcinoma patients. (A) and (B) Kaplan-Meier survival analysis based on the TCGA human lung dataset exhibiting no significantly improved clinical overall survival (OS) and recurrence free survival (RFS) in adenocarcinoma patients with higher SFRP4 mRNA expression. (C) and (D) Abundant SFRP3 mRNA expression promotes a significantly improved OS and RFS for adenocarcinoma patients. Red line: higher SFRP3 mRNA expression (median > 272.11); black line: moderate SFRP3 expression (median ≤ 272.11). Vertical lines: censored cases. (E) and (F) Univariate survival analysis based on the Kaplan-Meier-Plotter software supporting improved OS for adenocarcinoma patients with high SFRP3 mRNA expression but no prognostic impact for post-progression free survival (cutoff value > 530).
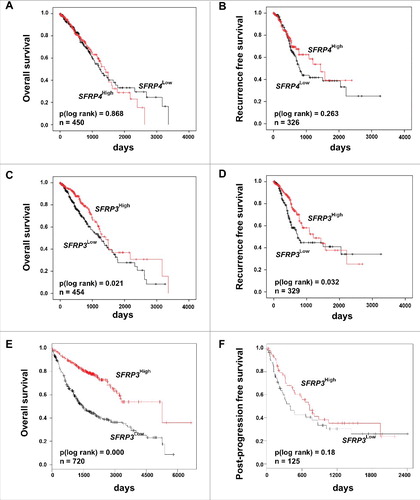
Figure 3. SFRP3 mRNA expression is lost in primary squamous cell carcinoma and reduced in advanced adenocarcinoma tissue samples. (A) SFRP3 mRNA expression is strongly reduced in NSCLC tissue samples (n = 11, median 0.275) in comparison to normal lung tissue (n = 11, median 1.00). (B) Scatter plot analysis represents reduced SFRP3 mRNA expression in primary lung tumor compared to normal lung tissue. Horizontal lines: grouped mean value. Vertical lines: SEM. **P < 0.01. (C) Box plot analysis based on the TCGA IlluminaHiSeq mRNA dataset showing reduced SFRP3 mRNA expression in primary lung tumor compared to normal lung tissue. Horizontal lines: grouped mean value. Vertical lines: SEM. ***P < 0.001. (D) and (E) SFRP3 mRNA expression is strongly reduced in squamous cell carcinoma and slightly reduced in adenocarcinoma compared with normal lung tissue. Tumor samples (based on TCGA IlluminaHiSeq) are split into adenocarcinoma (dark green, n = 518), squamous cell carcinoma (light green, n = 498), and normal tissue samples (gray, n = 205) (left panel). The relative SFRP3 mRNA expression values are illustrated in red (high expression) and green (low expression). (F) Box plot analysis of SFRP3 mRNA expression in adenocarcinoma subdivided into pT status shows decreased SFRP3 gene expression in pT2-4 compared to pT1. Horizontal lines: grouped medians. Boxes: 25–75% quartiles. Vertical lines: range, peak, and minimum. ***P < 0.001. (G) Box plot analysis shows decreased SFRP3 mRNA expression in metastatic adenocarcinoma tissue samples compared to non-metastatic adenocarcinoma tissues. Horizontal lines: grouped medians. Boxes: 25–75% quartiles. Vertical lines: range, peak, and minimum. *P < 0.05 (H) Box plot analysis illustrates reduced expression of SFRP3 in stage II and stage IV adenocarcinoma tissue samples compared with stage I. Horizontal lines: grouped medians. Boxes: 25–75% quartiles. Vertical lines: range, peak, and minimum. *P < 0.05
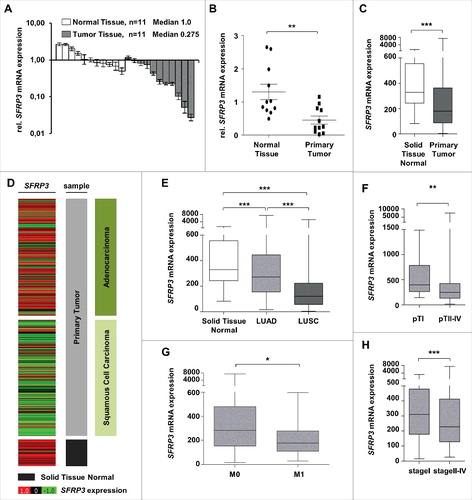
Figure 4. Loss of SFRP3 protein expression in human squamous cell carcinoma and adenocarcinoma of the lung. (A) Scatter plot analysis represents reduced SFRP3 immunoreactivity in primary LUAD samples (median: 2) and loss of SFRP3 protein in LUSC tissue (median: 0) compared to normal lung tissue (median: 4). Horizontal lines: median value. Vertical lines: probe ranges. **P < 0.01 ***P < 0.001 (B) Clear positive immunoreactivity in ciliated bronchial epithelium. (C and D) Strong SFRP3 protein staining in normal lung tissue, especially in type I and II pneumocytes of alveolar walls. (E) Negative control of normal lung tissue. Primary antibody was omitted. (F to H) Low SFRP3 immunoreactivity in the cytoplasm of advanced adenocarcinoma of the lung, indicating an IRS of 2 (F and G) and an IRS of 4 (H). (I to K) Loss of SFRP3 staining in the cytoplasm of primary squamous cell carcinoma samples, IRS of 0.
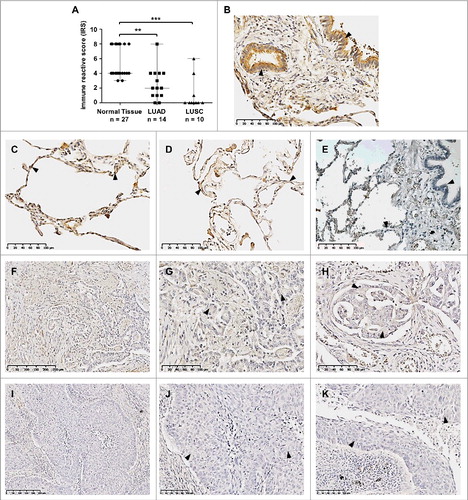
Figure 5. Reduction of SFRP3 mRNA expression highly correlates with epigenetic inactivation in adenocarcinoma but not in squamous cell carcinoma. (A) and (B) DNA hypermethylation of the SFRP3 promoter analyzed in primary tumor and normal tissue samples based on data of the TCGA Illumina HumanMethylation450 platform. Patient samples are split into adenocarcinoma (dark green, n = 446), squamous cell carcinoma (light green, n = 357), and normal tissue samples (gray, n = 104). The relative SFRP3 DNA methylation values for each CpG are illustrated in red (high methylation), white (mean methylation), and blue (low methylation). SFRP3 hypermethylation is strongly increased in adenocarcinoma and squamous cell carcinoma samples compared to normal lung tissue. Horizontal lines: grouped medians. Boxes: 25–75% quartiles. Vertical lines: range, peak, and minimum, ***P < 0.001. (C) and (D) Correlation analyses demonstrate a highly significant inverse correlation between SFRP3 mRNA expression (TCGA IlluminaHiSeq mRNA expression platform) and DNA hypermethylation (TCGA Illumina HumanMethylation450 platform) in primary adenocarcinoma samples (n = 424; Spearman r = −0.3084; P < 0.0001) but not in squamous cell carcinoma samples (n = 355; Spearman r = −0.0074; P = 0.8887).
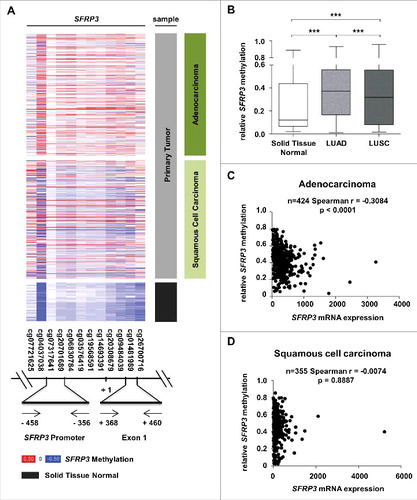
Figure 6. Methylation analysis of the SFRP3 gene showing hypermethylation of exon1 in NSCLC tissue samples. (A) Schematic image showing the location of 12 analyzed CpG duplets and positions of primer sets (-458 to -356 bp and +368 to +460 bp; 5′ to 3′) for SFRP3 promoter and exon1. +1: SFRP3 transcription start site. (B) to (E) Pyrosequencing analysis of primary tumor tissues (n = 15) and normal tissues (n = 12) demonstrates a significant increase of methylation in SFRP3 exon1 but not in SFRP3 promoter. Scatter plots illustrate mean methylation of each tissue sample analyzed for promoter and exon1. Area charts visualize mean methylation for each CpG of normal tissue and primary tumor tissue. Horizontal lines: grouped mean value. Vertical lines: SEM. ☆P < 0.05
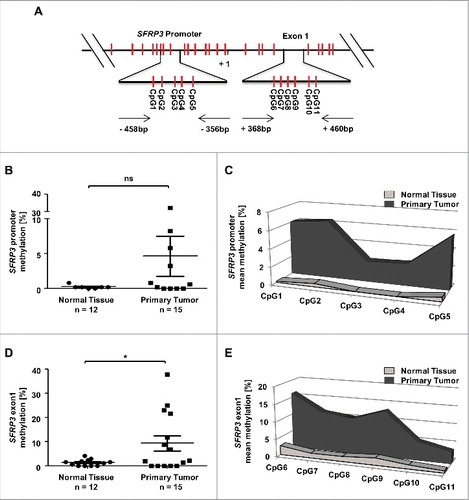
Figure 7. SFRP3 mRNA re-expression after in vitro demethylation of adenocarcinoma cell lines A549 and SK-LU-I. (A) Semiquantitative real-time PCR showing SFRP3 mRNA expression without and after treatment with 5-aza-2’-deoxycytidine (DAC) and Trichostatin A (TSA) in the adenocarcinoma cell line A549. Increased SFRP3 mRNA expression is shown as fold-change relative to untreated A549 control cells. (B) and (C) Quantitative SFRP3 exon1 methylation was analyzed by pyrosequencing of six CpG duplets in A549 cells without and after DAC and TSA treatment. Area charts visualize mean methylation for each CpG of untreated, DAC, TSA, and DAC/TSA treated cells. (D) Semi quantitative real-time PCR showing SFRP3 mRNA expression without and after treatment with DAC and TSA in the adenocarcinoma cell line SK-LU-1. Increased SFRP3 mRNA expression is demonstrated as fold-change relative to untreated control cells. (E) and (F) Quantitative SFRP3 exon1 methylation was analyzed by pyrosequencing of six CpG duplets in SK-LU-1 cells without and after treatment with DAC and TSA. Area charts visualize mean methylation for each CpG relative to the respective treatment of SK-LU-1 cells.
Figure 8. Increased SFRP3 mRNA expression reduced cell proliferation and CyclinD1 mRNA expression in a WNT1 dependent manner. (A) Cell proliferation rate of SFRP3-expressing A549 single cell clones and mock cells was measured by XTT-assay at about four days. For each sample data were normalized to the absorption on day 0. (B) XTT-proliferation assay was performed about four days after transient SFRP3 mRNA expression in adenocarcinoma cell line SK-LU-1. For each sample, data were normalized to the absorption on day 0. (C) XTT-proliferation assay was performed after WNT signaling pathway induction via transient WNT1 transfection in SFRP3-expressing and mock A549 clones, additionally transiently transfected with empty vector control. Proliferation rate was measured after 96 h cultivation and normalized to absorption on day 0. (D) Semiquantitative real-time PCR after WNT1 induction showing loss of CCND1 mRNA expression in SFRP3 and WNT1 expressing cells. Decreased CCND1 mRNA expression is shown as fold-change normalized to empty vector-transfected (mock) A549 cells.
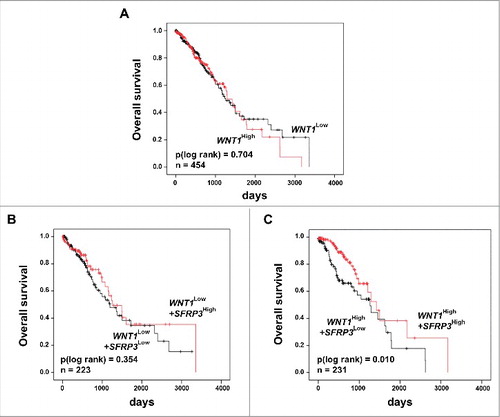
Figure 9. Univariate Kaplan-Meier survival analysis of combined high SFRP3 and WNT1 mRNA expression indicated a favorable prognosis for adenocarcinoma patients. (A) Kaplan-Meier survival analysis based on the TCGA human lung dataset illustrates no prognostic value for the proto-oncogene WNT1. (B) Univariate Kaplan-Meier analysis of adenocarcinoma patients with low WNT1 mRNA expression shows no prognostic benefit provided by SFRP3 mRNA expression. (C) Univariate survival analysis reveals a better prognostic outcome for adenocarcinoma patients with high WNT1 and high SFRP3 mRNA expression. Patients were dichotomized by high WNT1 mRNA expression (median > 2.52) and low WNT1 expression (median ≤ 2.52). Red line: higher SFRP3 mRNA expression (median > 272.11); black line: moderate SFRP3 expression (median ≤ 272.11). Vertical lines: censored cases.