Figures & data
Figure 1. 5-AZA treatment restores Cdkn1c expression in unresponsive cells. (A) qPCR analysis of the MeDIP assay performed on the KvDMR1 sub-region bound by MyoD (KvDMR1-MyoD) and on the Cdkn1c promoter in untreated (Ctr) and 5-AZA-treated samples. Values are expressed as percentages of Input DNA. Error bars indicate standard error of the mean (SEM) for each sample analyzed in triplicate. (B) RT-qPCR in unresponsive cells (C3H10T1/2 fibroblasts) infected with either the empty vector retrovirus (Vector) or the MyoD-encoding retrovirus (MyoD) and treated as above. Statistical significance: P < 0.01 (**). (C) RT-qPCR analysis of myogenin and MyoD expression in unresponsive cells infected with MyoD and treated as above. Values, relative to those of 18S RNA, are the mean of 4 independent experiments ± SEM. Statistical significance: ns (not significant). (D) Allele-specific RT-qPCR analysis of Cdkn1c expression in hybrid fibroblasts (C57BL/6 female x SD7 male) infected with MyoD and treated as above; values, normalized on 18S expression, are the mean of 3 independent experiments ± SEM. Statistical significance: ns. M: maternal; P: paternal.
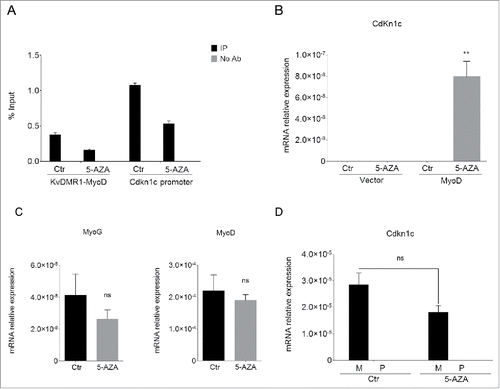
Figure 2. 5-AZA treatment restores the functional interaction of MyoD with KvDMR1. (A) Schematic diagram of the KvDMR1 region (as defined by Fitzpatrick and coworkersCitation11). The narrow vertical bars represent the position of CpG dinucleotides; the horizontal bars indicate the positions of the KvDMR1 sub-region spanning the transcriptional start site and the 3′-portion of Kcnq1ot1 promoter (KvDMR1-ot1) and of the KvDMR1 sub-region bound by MyoD (KvDMR1-MyoD); the small black rectangle indicate the MyoD-binding site; the lower enlargements represent the fragments sequenced after sodium bisulfite treatment (Bisulfite amplicons 1 and 2) or amplified in ChIP and MeDIP assays (ChIP/MeDIP amplicon), as well as the position of the CpG dinucleotides included. (B) ChIP-qPCR analysis of MyoD binding in unresponsive cells (C3H10T1/2 fibroblasts) expressing exogenous MyoD, and treated with 5-AZA or untreated (Ctr). Values obtained for the binding to KvDMR1 were normalized to those for the binding to myogenin promoter, which is a CpG poor region, and expressed as percentages of Input chromatin. The results, derived from 3 independent experiments, are reported as mean ± SEM. Statistical significance: P < 0.01 (**). (C) 3C-qPCR analysis of the KvDMR1-Cdkn1c promoter interaction in cells expressing MyoD and treated as in (A). Values are reported as fold change of the interaction frequencies in the presence of 5-AZA relative to untreated controls (Ctr). The 3C analysis of a constitutive and ubiquitous long-range interaction occurring at the ERCC3 locus was used as a positive control for digestion and ligation of the 3C samples. The results shown for both interactions correspond to the means of 2 independent experiments. Error bars represent SEM.

Figure 3. Differential methylation at the KvDMR1 sub-region bound by MyoD correlates with the imprinting status rather than with the differential responsiveness. (A) Bisulfite sequence analysis showing the methylation status of the 27 CpG dinucleotides included in the Bisulfite amplicon 1 shown in A, in unresponsive (C3H10T1/2 fibroblasts) and responsive cells (C57BL/6 fibroblasts). Each circle indicates an individual CpG dinucleotide. Each row of circles corresponds to an individual clone of the bisulfite-PCR product. Empty and filled circles indicate unmethylated and methylated CpGs, respectively. Absent circles represent ambiguous data. (B) Allele-specific bisulfite sequence analysis in hybrid fibroblasts (C57BL/6 female x SD7 male) showing the methylation status of the 38 CpGs located in the Bisulfite amplicon 2 shown in . The SNP in this region causes the loss of a CpG on the paternal (P) respect to the maternal (M) allele. The gap is represented by a dash.
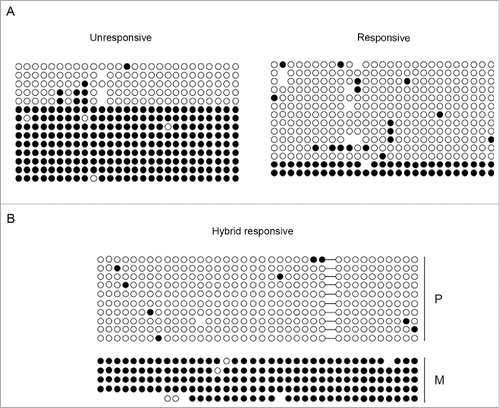
Figure 4. Responsive and unresponsive cells display differential H3K9me2 at KvDMR1. (A) Western blot assay showing the total level of H3K9me2 in unresponsive (C3H10T1/2 fibroblasts) and responsive cells (C57BL/6 fibroblasts). Histone H3 was used as a loading control. (B) ChIP-qPCR analysis of H3K9me2 enrichment at the 2 KvDMR1 sub-regions and Cdkn1c promoter (Cdkn1c prom) in unresponsive and responsive cells. Actin promoter (Actin prom) was used as negative control. Values obtained for the enrichment were normalized to those on β-globin promoter, used as an invariant control, and expressed as percentages of Input chromatin. The results, derived from 2 independent experiments, are reported as mean ± SEM. Statistical significance: P < 0.05 (*). ns: not significant.
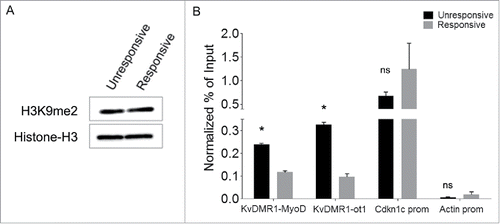
Figure 5. 5-AZA treatment reduces both DNA methylation and H3K9me2 at KvDMR1 in unresponsive cells. (A) The left panel shows the bisulfite sequence analysis of the same KvDMR1-MyoD sub-region analyzed in , performed in unresponsive cells (C3H10T1/2 fibroblasts) treated with 5-AZA. The results are reported as explained in . The right panel shows quantitative analysis of the DNA methylation percentages at the entire sub-region (KvDMR1-MyoD) in 5-AZA-treated cells respect to the control (Ctr). Values refer to the data shown in , for Ctr, and in for 5-AZA samples. Error bars represent SEM. Statistical significance: P < 0.001 (***). (B) The left panel shows the bisulfite sequence analysis of the Cdkn1c promoter, performed in unresponsive cells (C3H10T1/2 fibroblasts) treated with 5-AZA. The results are reported as explained in . The right panel shows the quantitative analysis of DNA methylation percentages in 5-AZA-reated respect to control sample; Values refer to our previously reported dataCitation21 for control and to those shown in for 5-AZA samples. Error bars represent SEM. Statistical significance: P < 0.001 (***). (C) ChIP-qPCR analysis of H3K9me2 enrichment at the 2 KvDMR1 sub-regions and Cdkn1c promoter (Cdkn1c prom) in untreated (Ctr) and 5-AZA treated unresponsive cells. β-globin promoter (β-globin prom) and actin promoter (Actin prom) were used as positive and negative controls respectively. Values obtained for the enrichment are the mean of 2 independent experiments and are expressed as percentages of Input chromatin. Error bars represent SEM. Statistical significance: P < 0.05 (*); ns: not significant.
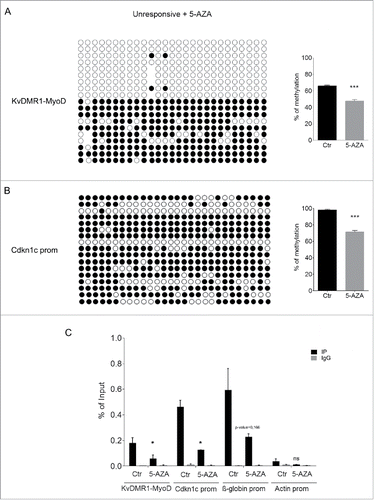
Figure 6. Cdkn1c silencing in human cancer cells correlates with H3K9me2 enrichment at KvDMR1. (A) ChIP-qPCR analysis of H3K9me2 enrichment at KvDMR1 in MCF-7 and MDA-MB-231 (MDA). Values obtained for the enrichment were normalized to those of APOC-III promoter, used as a positive control, and expressed as percentages of Input chromatin. The results, derived from 2 independent experiments, are reported as mean ± SEM. Statistical significance: P < 0.05 (*). (B) RT-qPCR analysis of Cdkn1c expression in MCF-7 cells untreated (Ctr) or 5-AZA treated samples. Values, relative to those of GAPDH RNA, are the mean of 3 independent experiments ± SEM. Statistical significance: P < 0.05 (*).
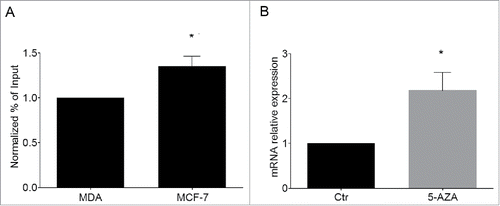
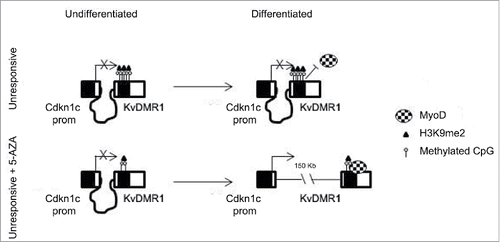
Figure 7. Schematic model of the mechanism by which 5-AZA restores the functional interaction of MyoD with KvDMR1 and the rescue of Cdkn1c induction in unresponsive cells. In unresponsive cells MyoD cannot bind to KvDMR1, due to the presence of a repressive chromatin conformation involving H3K9me2. The failed MyoD binding does not allow the disruption of the repressive chromatin contact between KvDMR1 and Cdkn1c promoter and Cdkn1c is not induced. After 5-AZA treatment not only DNA methylation but also H3K9me2 levels decrease at KvDMR1, allowing MyoD binding to KvDMR1 and causing the release of the chromatin loop and thus induction of Cdkn1c.