2,087
Views
30
CrossRef citations to date
0
Altmetric
Research Paper

Wilson Disease: Epigenetic effects of choline supplementation on phenotype and clinical course in a mouse model

, , , , , , , , , , , , , , , , & show all
Pages 804-818 | Received 15 Jun 2016, Accepted 26 Aug 2016, Published online: 01 Nov 2016

Figures & data

Figure 1. Study design. Wild type or tx-j mice were fed diets with or without choline supplementation 2 weeks before mating through embryonic day 17. Fetal livers were harvested and RNA-seq was performed. Another set of tx-j offspring were weaned and continued on diets with or without choline supplementation. Subgroups of tx-j offspring on each diet were given penicillamine (PCA) treatment.
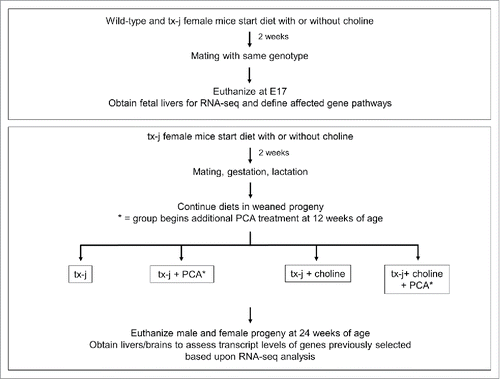
Figure 1. Study design. Wild type or tx-j mice were fed diets with or without choline supplementation 2 weeks before mating through embryonic day 17. Fetal livers were harvested and RNA-seq was performed. Another set of tx-j offspring were weaned and continued on diets with or without choline supplementation. Subgroups of tx-j offspring on each diet were given penicillamine (PCA) treatment.

Figure 2. Principal component analysis scores plot of significantly differentially expressed genes in fetal liver. Each symbol represents a mouse. Symbols that are closer to one another are more similar. Ellipses represent 95% confidence intervals based on Hotelling's T2 statistic.
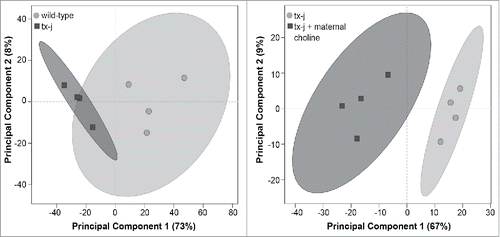
Figure 2. Principal component analysis scores plot of significantly differentially expressed genes in fetal liver. Each symbol represents a mouse. Symbols that are closer to one another are more similar. Ellipses represent 95% confidence intervals based on Hotelling's T2 statistic.

Table 1. Top pathways identified by WebGestalt Pathway Analysis in fetal livers.

Table 2A. Top four pathways identified by WebGestalt Pathway Analysis in fetal livers.

Table 2B. Top four pathways identified by WebGestalt Pathway Analysis.

Table 3. Fetal RNA-seq transcript levels for select oxidative phosphorylation genes.

Figure 3. Liver histology from tx-j mice at 24 weeks of age. Hematoxylin and eosin, 100 X. Untreated tx-j mice presented mild inflammation and steatosis with more inflammation occurring in males compared to females in the same diet group. Steatosis improved in female tx-j mice after penicillamine (PCA) treatment. Whereas choline did not change histology scores, the combination of PCA and choline was associated with higher grade of steatosis compared to all other groups. Results are expressed as mean ± standard deviation. Between group differences were analyzed by 1-way ANOVA; values with different letter symbols are significantly different (P < 0.05) from each other. Differences between sexes in the same treatment group were analyzed by Student's t-test; values with an asterisk (*) are significantly different (P < 0.05) between sexes.
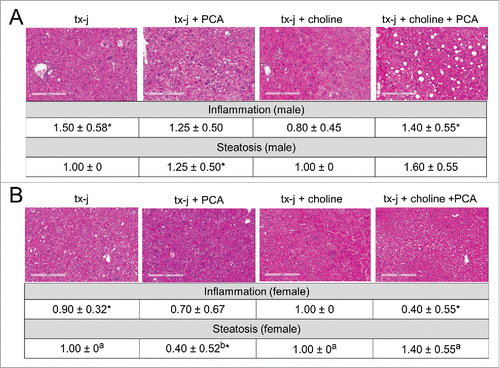
Figure 3. Liver histology from tx-j mice at 24 weeks of age. Hematoxylin and eosin, 100 X. Untreated tx-j mice presented mild inflammation and steatosis with more inflammation occurring in males compared to females in the same diet group. Steatosis improved in female tx-j mice after penicillamine (PCA) treatment. Whereas choline did not change histology scores, the combination of PCA and choline was associated with higher grade of steatosis compared to all other groups. Results are expressed as mean ± standard deviation. Between group differences were analyzed by 1-way ANOVA; values with different letter symbols are significantly different (P < 0.05) from each other. Differences between sexes in the same treatment group were analyzed by Student's t-test; values with an asterisk (*) are significantly different (P < 0.05) between sexes.
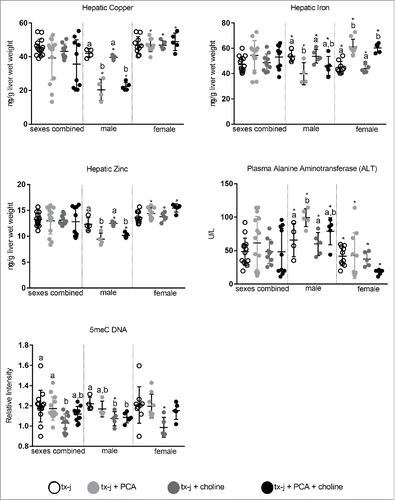
Figure 4. Hepatic copper, iron zinc concentrations, plasma triglycerides and ALT, and global hepatic DNA methylation. Results are expressed as mean ± standard deviation. Between group differences were analyzed by 1-way ANOVA; values with different letter symbols are significantly different (P < 0.05) from each other. Differences between sexes in the same treatment group were analyzed by Student's t-test; values with an asterisk (*) are significantly different (P < 0.05) between sexes.
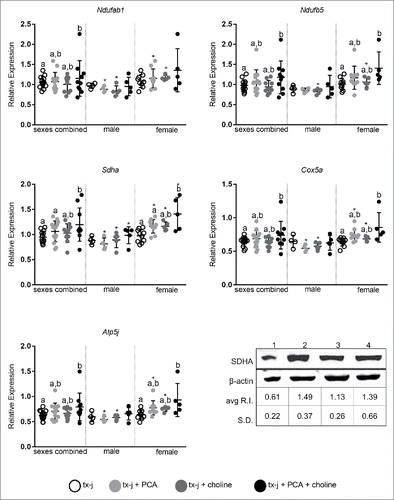
Figure 4. Hepatic copper, iron zinc concentrations, plasma triglycerides and ALT, and global hepatic DNA methylation. Results are expressed as mean ± standard deviation. Between group differences were analyzed by 1-way ANOVA; values with different letter symbols are significantly different (P < 0.05) from each other. Differences between sexes in the same treatment group were analyzed by Student's t-test; values with an asterisk (*) are significantly different (P < 0.05) between sexes.

Figure 5. Transcript levels of genes representative of oxidative phosphorylation (Ndufab1, Ndufb5, Sdha, Cox5a, Atp5j). Transcript expression data are normalized to Gapdh (10–22 mice/group). Protein relative expression (R.I.) according to Western blots analyses for SDHA are reported; lane 1: tx-j; lane 2: tx-j + PCA; lane 3: tx-j + choline; lane 4: tx-j + choline + PCA. Results are expressed as mean ± standard deviation. Between group differences were analyzed by 1-way ANOVA; values with different letter symbols are significantly different (P< 0.05) from each other. Differences between sexes in the same treatment group were analyzed by Student's t-test; values with an asterisk (*) are significantly different (P < 0.05) between sexes.

Figure 5. Transcript levels of genes representative of oxidative phosphorylation (Ndufab1, Ndufb5, Sdha, Cox5a, Atp5j). Transcript expression data are normalized to Gapdh (10–22 mice/group). Protein relative expression (R.I.) according to Western blots analyses for SDHA are reported; lane 1: tx-j; lane 2: tx-j + PCA; lane 3: tx-j + choline; lane 4: tx-j + choline + PCA. Results are expressed as mean ± standard deviation. Between group differences were analyzed by 1-way ANOVA; values with different letter symbols are significantly different (P< 0.05) from each other. Differences between sexes in the same treatment group were analyzed by Student's t-test; values with an asterisk (*) are significantly different (P < 0.05) between sexes.

Figure 6. Plasma acylcarnitines and plasma triglycerides. Results are expressed as mean ± standard deviation. Plasma Acylcarnitines: Significant differences between 2 groups were assessed by Student's t-test. Values with different letter symbols are significantly different (P< 0.05) from each other. Plasma Triglycerides: Between group differences were analyzed by 1-way ANOVA; values with different letter symbols are significantly different (P < 0.05) from each other.
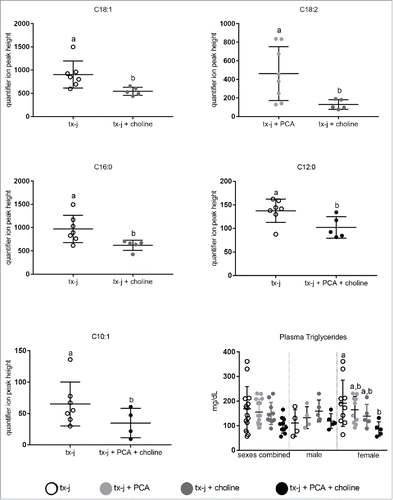
Figure 6. Plasma acylcarnitines and plasma triglycerides. Results are expressed as mean ± standard deviation. Plasma Acylcarnitines: Significant differences between 2 groups were assessed by Student's t-test. Values with different letter symbols are significantly different (P< 0.05) from each other. Plasma Triglycerides: Between group differences were analyzed by 1-way ANOVA; values with different letter symbols are significantly different (P < 0.05) from each other.

Figure 7. Transcript levels of genes representative of methionine metabolism, DNA methylation (Sahh, Dnmt1, Dnmt3a, Dnmt3b), and lipid metabolism (Srebf1). Transcript expression data are normalized to Gapdh (10–14 mice/group). Protein relative expression (R.I.) according to Western blot analyses for SAHH and SREBP1 are reported; lane 1: tx-j; lane 2: tx-j + PCA; lane 3: tx-j + choline; lane 4: tx-j + choline + PCA. Results are expressed as mean ± standard deviation. Between group differences were analyzed by 1-way ANOVA; values with different letter symbols are significantly different (P < 0.05) from each other. Differences between sexes in the same treatment group were analyzed by Student's t-test; values with an asterisk (*) are significantly different (P < 0.05) between sexes. PCA, penicillamine.
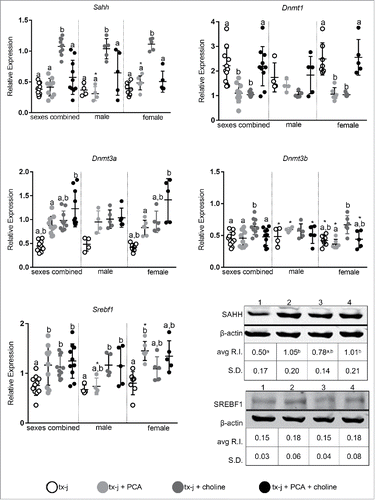
Figure 7. Transcript levels of genes representative of methionine metabolism, DNA methylation (Sahh, Dnmt1, Dnmt3a, Dnmt3b), and lipid metabolism (Srebf1). Transcript expression data are normalized to Gapdh (10–14 mice/group). Protein relative expression (R.I.) according to Western blot analyses for SAHH and SREBP1 are reported; lane 1: tx-j; lane 2: tx-j + PCA; lane 3: tx-j + choline; lane 4: tx-j + choline + PCA. Results are expressed as mean ± standard deviation. Between group differences were analyzed by 1-way ANOVA; values with different letter symbols are significantly different (P < 0.05) from each other. Differences between sexes in the same treatment group were analyzed by Student's t-test; values with an asterisk (*) are significantly different (P < 0.05) between sexes. PCA, penicillamine.
Supplemental material

KEPI_A_1231289_supplementary_data.zip

Download Zip (12.4 MB)

Reprints and Corporate Permissions

Please note: Selecting permissions does not provide access to the full text of the article, please see our help page How do I view content?

To request a reprint or corporate permissions for this article, please click on the relevant link below:

Academic Permissions

Please note: Selecting permissions does not provide access to the full text of the article, please see our help page How do I view content?

Obtain permissions instantly via Rightslink by clicking on the button below:

If you are unable to obtain permissions via Rightslink, please complete and submit this Permissions form. For more information, please visit our Permissions help page.