Figures & data
Table 1. Results from the behavioral tests conducted on female and male adult mice.
Figure 1. Results from the light and dark box test on female adult mice. (A) The amount of time spent in the light compartment of the apparatus in seconds (s) and (B) the number of entries into the dark compartment of the apparatus for the prenatal stressed (Pre-S), postnatal stressed (Post-S), and non-stressed (Non-S) mice. An asterisk denotes a significant difference (P-value < 0.05).
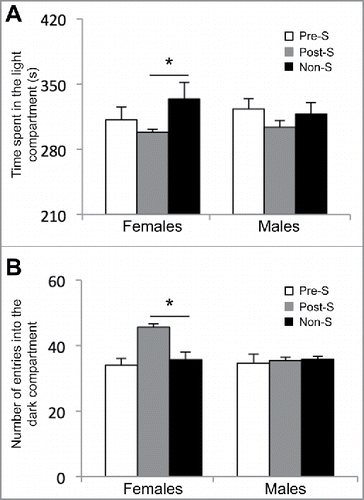
Figure 2. Characterization of DhMRs across standard genomic structures. (A) Modified Manhattan plot of early-life stress-associated DhMRs from the mouse hypothalamus reveals DhMRs to be distributed across the entire genome. Positively and negatively correlated DhMRs are displayed with the -log10 of the P-value. Significant DhMRs are displayed outside the purple lines (P-value < 0.05), while all DhMRs alternate between black and gray to indicate each chromosome. (B) Schematic of the standard genomic structures investigated. DhMR and all 5hmC data were annotated to the following genomic features: 3 promoter (Prmtr) regions located 2–3 kb, 1–2 kb, and up to 1 kb upstream (≤ 1 kb) of the transcription start site; the 5′ untranslated region (UTR); first exon; first intron; other exon; other intron; 3′ UTR; up to 3 kb downstream of transcription end site (≤ 3 kb); and the intergenic regions (> 3 kb upstream or downstream of nearest gene). (C) Pie chart displaying the proportion of all DhMRs falling into each investigated genomic structure. Structures containing a significant over- or under-representation of DhMRs when compared with all 5hmC peaks are indicated (*), which were determined by permutation testing (P-value < 0.05). Columns indicate the percent of all 5hmC peak data (5hmC) and DhMRs in each genomic structure shown. (D) A breakdown of hyper- and hypo-DhMRs in each genomic structure. The percent distribution (y-axis) of all 5hmC peak data (striped), DhMRs (black), hyper-DhMRs (white), and hypo-DhMRs (gray) in each genomic structure is shown. Significant over- and under-representation of DhMRs are indicated (*) for each structure (P-value < 0.05).
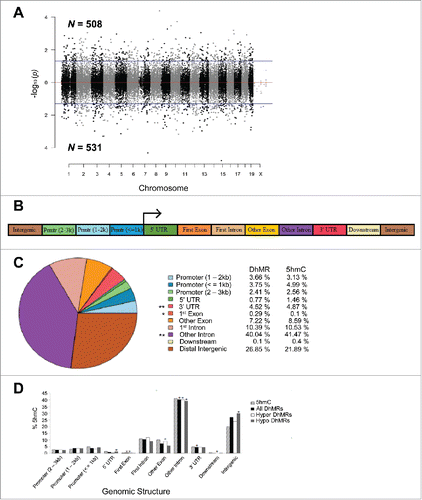
Figure 3. Annotation of DhMRs to genes. (A) Venn diagram displaying the proportion of DhMR-associated genes (blue; n = 880) overlapping with genes that have a known role in stress-response (yellow; n = 4,348). The overlap (n = 338) is significant, as indicated by and asterisk (Chi-square P-value < 0.001). (B) Gene schematics of the top 3 statistically significant differentially expressed isoforms from known stress-related genes containing a DhMR. Transcripts are depicted as either the whole-gene transcripts or differentially expressed isoforms from control (white) and stressed (red) mice. The relative genomic location of the DhMR (gold box) is shown, hyper-DhMRs are near stressed (red) mice transcripts and hypo-DhMRs are near control (white) mice transcripts. (C) Gene schematics of the top 3 statistically significant differentially expressed isoforms from genes containing a DhMR and that are known to play a role in psychiatric-disorders. Transcripts are depicted as either the whole-gene transcripts or differentially expressed isoforms from control (white) and stressed (red) mice. The relative genomic location of the DhMR (gold box) is shown, hyper-DhMRs are near stressed (red) mice transcripts and hypo-DhMRs are near control (white) mice transcripts. An asterisk indicates which exons have been either partially or completely excluded from the isoform shown.
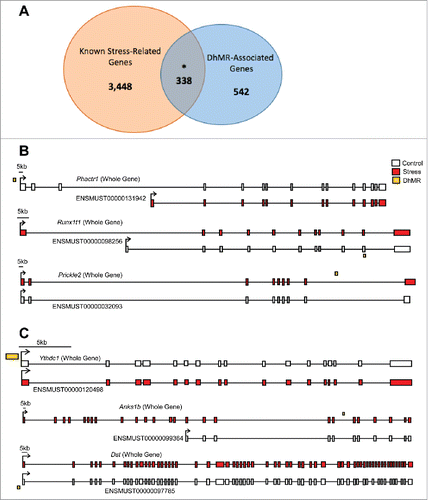
Table 2. Top 5 Gene Ontology Terms for Hyper-DhMRs.
Table 3. Top 5 Gene Ontology Terms for Hypo-DhMRs.
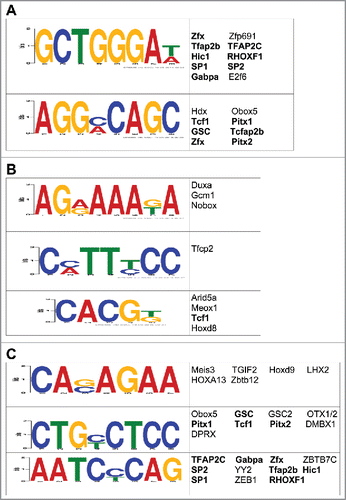
Figure 4. Characterization of the potential role(s) of DhMRs in gene expression. (A-C) Identification of DhMR-associated transcription factor sequence motifs that were predicted by the DREME suite (E-value < 10e-3) in hyper- (a), hypo- (b), and potentially functional (c) DhMRs. The putative transcription binding factors were predicted using SpaMo directly from the DREME suite and are shown next to each sequence motifs. Transcription factors associated with hyper- and/or hypo-DhMRs (a-b) that are shared between those found in the potentially functional DhMR sequences (c) are indicated by a bold font.