Figures & data
Figure 1. Relationship between methylation and expression of LCT13 L1ASP in CRC. (A) Top: Schematic diagram of the LCT13 genomic locus on human chromosome 7 (chr7:93,204,042–93,540,485; center) with indicated the positions of the CALCR, TFPI-2, and GNGT1 genes and of the 2 intact intergenic LINE1s (L1) present in this region. Middle: enlargement of the LINE-1 (L1PA2: chr7:93,213,393–93,221,079, with an SVA_D spanning the interval 93,214,544–93,216,214) from which LCT13 originates with the regions (black bars) tested by bisulfite or hMeDIP and ChIP. Bottom: enlargement of the LCT13 spliced transcript with indicated its exon structure [LINE-1 5′UTR fragment in light gray (chr7:93,220,882–93,221,083) and, in dark gray, the 2 GNGT1 exons (93,536,051–93,536,154 and 93,540,102–93,540,235), part of the LCT13 transcript]. Also indicated are the positions of the Taqman assay used for LCT13 expression studies located at the splice junction (black bar) and of the primers used for 5′RACE (arrows). All coordinates are from hg19 annotations; scale is in kilobase pairs (kb). (B) Bar charts showing the expression of LCT13 measured by real time RT-PCR and expressed relatively to the geometric mean of 3 reference genes in matched normal (dark gray, N) and tumor (light gray, T) tissues from 6 colorectal cancer patients (left panel) and 6 cell lines (right panel). NC: normal colon, commercially sourced total RNA from 7 healthy donors pooled together. (C) Bar charts of the methylation levels measured by bisulfite sequencing in the tissues of the 6 patients and cell lines presented in B.
![Figure 1. Relationship between methylation and expression of LCT13 L1ASP in CRC. (A) Top: Schematic diagram of the LCT13 genomic locus on human chromosome 7 (chr7:93,204,042–93,540,485; center) with indicated the positions of the CALCR, TFPI-2, and GNGT1 genes and of the 2 intact intergenic LINE1s (L1) present in this region. Middle: enlargement of the LINE-1 (L1PA2: chr7:93,213,393–93,221,079, with an SVA_D spanning the interval 93,214,544–93,216,214) from which LCT13 originates with the regions (black bars) tested by bisulfite or hMeDIP and ChIP. Bottom: enlargement of the LCT13 spliced transcript with indicated its exon structure [LINE-1 5′UTR fragment in light gray (chr7:93,220,882–93,221,083) and, in dark gray, the 2 GNGT1 exons (93,536,051–93,536,154 and 93,540,102–93,540,235), part of the LCT13 transcript]. Also indicated are the positions of the Taqman assay used for LCT13 expression studies located at the splice junction (black bar) and of the primers used for 5′RACE (arrows). All coordinates are from hg19 annotations; scale is in kilobase pairs (kb). (B) Bar charts showing the expression of LCT13 measured by real time RT-PCR and expressed relatively to the geometric mean of 3 reference genes in matched normal (dark gray, N) and tumor (light gray, T) tissues from 6 colorectal cancer patients (left panel) and 6 cell lines (right panel). NC: normal colon, commercially sourced total RNA from 7 healthy donors pooled together. (C) Bar charts of the methylation levels measured by bisulfite sequencing in the tissues of the 6 patients and cell lines presented in B.](/cms/asset/bb1435b3-4bad-4e51-8cd0-f9a0d9dbd86b/kepi_a_1300729_f0001_b.gif)
Figure 2. Relationship between L1–5′UTR methylation and LCT13 transcription start sites in cell lines. (A) Schematic diagram showing the 5′UTR of the L1PA2 driving LCT13 (chr7: 93,220,579–93,221,079) with indicated the regions analyzed by bisulfite sequencing (black bar; chr7: 93,220,643–93,221,121) and the positions of the 29 CpG sites (vertical black lines) within it. All coordinates are from hg19 annotations and the scale is in base pairs (bp). Indicated are all the transcription start sites (TSS; bent arrows) identified in the cell lines by 5′RACE demonstrating scattered transcription initiation (light gray) (see also Fig. S3). (B) Diagrams combining the lollipops summarizing the average methylation at each of the 29 CpG site analyzed in the panels of colorectal (CRC) and breast (BC) cancer cell lines (see Fig. S2) with the stronger TSS site identified for the particular cell line (thick bent arrows). No TSS was identified by 5′RACE in RKO and SW480 cell lines, consistent with lack of detectable LCT13 transcripts in these cells ().
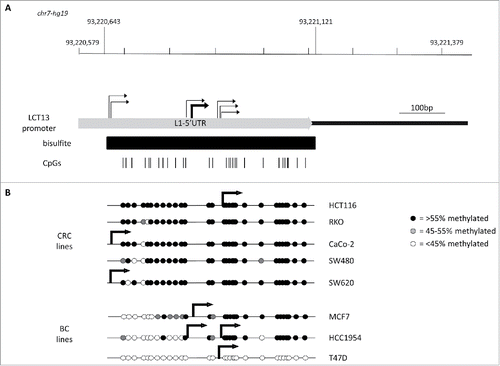
Figure 3. Relationship between methylation and expression of LCT14 in CRC. (A) Schematic diagram of the LCT14 genomic locus on human chromosome 5 (coordinates: 24,487,209–27,038,689) with indicated positions of the annotated genes CDH10, LOC105374693, and CDH9 and of the intact intergenic LINE1 (L1) that drives transcription of LCT14. At the bottom is an enlargement of the region including the LINE-1 (L1PA2; chr5:25,378,639–25,384,665) from which LCT14 originates with the regions (black bars) tested by bisulfite or hydroxymethylated DNA (hMeDIP) and chromatin (ChIP) immunoprecipitations and, below these, the LCT14 transcript (chr5: 25,384,485–25,384,958) and the region amplified for expression studies. All coordinates are from hg19 annotations; scale is in kb. (B) Expression of LCT14 measured by real-time RT-PCR and expressed relatively to the geometric mean of 3 reference genes in matched normal (dark gray) and tumor (light gray) tissues from 4 colorectal cancer patients (left panel) and of 5 colorectal cancer cell lines (right panel). (C) Methylation levels measured by bisulfite sequencing in the paired normal and tumor tissues of the 4 patients (left panel) and cell lines (right panel) described in B.
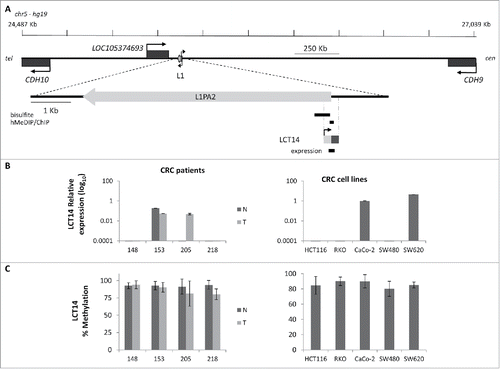
Figure 4. Analysis of 5hmC at LCT13 and LCT14 in cancer cell lines. Levels of hydroxymethylcytosine (hmeC) obtained by hMeDIP and expressed as % of Input. hmeCTRL: hydroxymethylated control DNA; meCTRL: methylated control DNA; unCTRL: unmethylated control DNA. The inset shows an enlargement of the region of the graph without the positive hmeCTRL indicating that some cell lines (Caco-2, SW480, SW620 and T47D) show minor enrichment at LCT13 and LCT14 L1ASPs, relative to the negative controls and the negative cell lines.
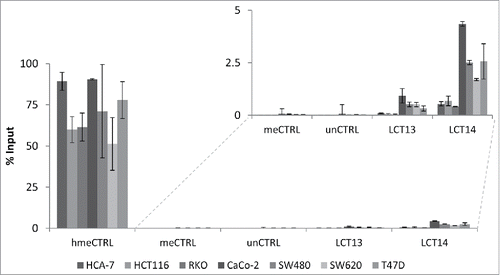
Figure 5. Effects of DNA methylation inhibition in colon cancer cell lines. Expression (A) and methylation (B) of LCT13 in HCT116 cells untreated or treated with DMSO vehicle alone or 1 μM 5-aza in DMSO. Treatment with 5-aza has no effect on LCT13 expression levels; no overall changes in the levels of DNA methylation are seen in either cell line. (C) Expression profile of LCT13 in HCT116 that are either wild type or lacking DNA methyltransferase 1 (DNMT1-KO), or 3B (DNMT3B-KO), or both DNMT1 and 3B (DKO). P values were calculated by one-way ANOVA. ***: P < 0.001
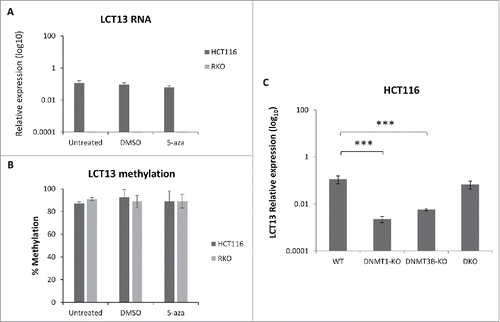
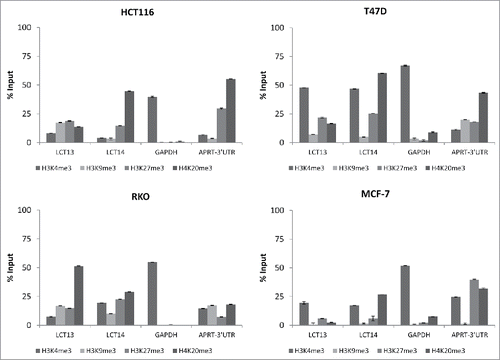
Figure 6. Histone modifications at LCT13 and LCT14 in cancer cell lines. ChIP assays performed using antibodies against active (H3K4me3) and repressive (H3K9me3, H3K27me3, H4K20me3) histone marks in LCT13 positive and LCT14 negative HCT116 cells (top left panel), in LCT13 and LCT14 negative RKO cells (bottom left panel), and in LCT13 and LCT14 positive T47D (top right panel) and MCF-7 (bottom right panel) cells. GAPDH is a promoter Taqman assay used as a positive control for H3K4me3 and APRT-3′UTR has been previously shown to be enriched at repressive mark H4K20me3.
