
Figures & data
Table 1. Reference information regarding each of the 11 data sets analyzed.
Table 2. Statistics corresponding to the age2 term of the regression model fitted separately to each of the 11 data sets for the CpG site, cg07955995 (Equation Equation1(Equation 1)
(Equation 1) ). The regression model includes covariates. Columns 1–3 include abbreviations of the data set, cell/tissue type, and the sample size. Columns 4–6 include the estimated rate of change in DNAm proportion per year at 50, 60, and 70 years of age. Columns 7–10 include the coefficient, standard error, T-statistic, and P-value on the age2 term.
Table 3. Statistics corresponding to the age2 term of the regression model fitted separately to each of the 11 data sets for the CpG site, cg22285878 (Equation Equation1(Equation 1)
(Equation 1) ).
Figure 1. Scatterplots of DNAm (y-axis) vs. age (x-axis) with fitted quadratic regression lines for each of the 11 data sets, holding covariates constant at their mean values.
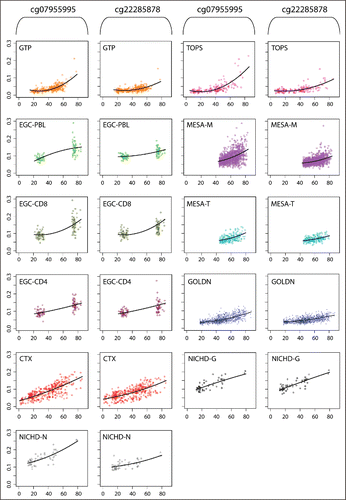
Figure 2. Plot of the variance of methylation across subjects at cg07955995 (left) and cg22285878 (right) for the older age group (73 years or older) against the younger age group for each data set. MESA-M, MESA-T, NICHD-G, and NICHD-N appear with different symbols because the age groups were calculated differently than the other data sets. For these 4 data sets, the median ages (in years) were used (58 for MESA-M, 60 for MESA-T, and 23 for both NICHD-G and NICHD-N) to create young groups (≤median) and old groups (>median) because MESA-M and MESA-T had no individuals less than 34 years of age and NICHD-G and NICHD-N only had 2 individuals older than 73 years.
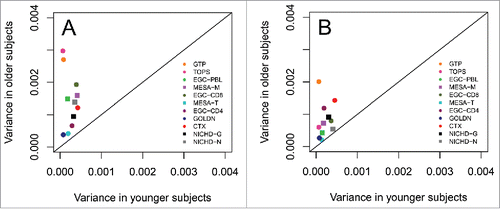
Table 4. Variances of the young age group, variances of the old age group, and P-values corresponding to the F-statistic calculated as the ratio of variances of the young and old age groups for each of the 11 data sets.