Figures & data
Figure 1. Peak sensitivity and noise as a function of the ratio of protein coated beads to the amount of genomic DNA (μL of beads to ng DNA). a) The CpG score (average number of fragments covering CpGs) is plotted on the left y-axis against the CpG density (number of CpGs per fragment) on the x-axis. The location of each distribution is indicated by the short vertical line at the maximum CpG score that we label “peak.” The gray line represents the proportion of CpGs (right y-axis) for a given CpG density (x-axis) in the genome. b) The same graph as is presented in (a) but here zoomed in to better visualize the region with low CpG density to illustrate how differences in peak affect the coverage of low CpG density regions that are most common in the genome. c) The bead to DNA ratios (x-axis) are plotted against the peak (left y-axis) and noise (right y-axis). Noise is measured as the ratio of fragment coverage of a set of genomic locations away from CpGs, so-called non-CpGs, vs. average coverage of CpGs. The dashed vertical line indicates a potential optimum consisting of a small peak (and hence better coverage of low CpG dense regions) and also low noise levels.
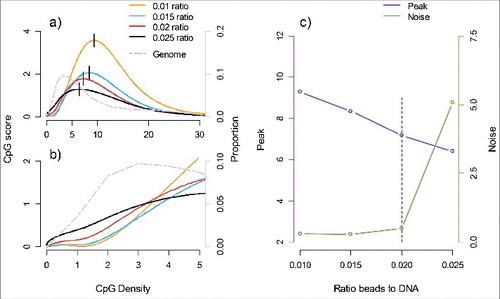
Figure 2. Peak sensitivity and noise across conditions with different amounts of starting material. The amount of starting material (x-axis) is plotted against the peak (left y-axis) and noise (right y-axis). For each amount of starting material we use the same bead to DNA ratio of 0.02.
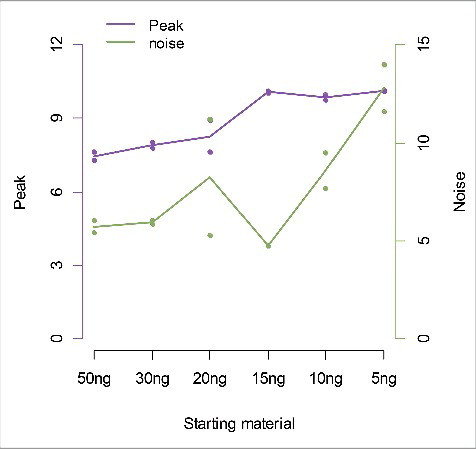
Figure 3. Sensitivity and specificity of MBD-seq. The blue lines represent sensitivity (proportion of methylated loci correctly detected) and the yellow lines specificity (proportion of non-methylated loci correctly detected). The (horizontal) dashed lines represent WGB-seq and (curved) solid lines MBD-seq. The y-axis indicates the estimated sensitivity/specific and the x-axis CpG score cut-offs used to determine methylation status according to the MBD-seq data. The first plot shows results for existing MBD-seq protocol using 1500 ng starting material. The other plots involve the low starting material protocol with amount of input DNA of 50 ng, 30 ng, 20 ng, 15 ng, 10 ng, and 5 ng.
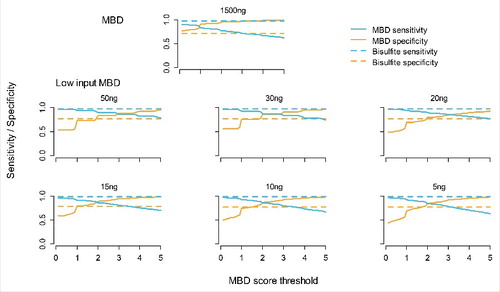
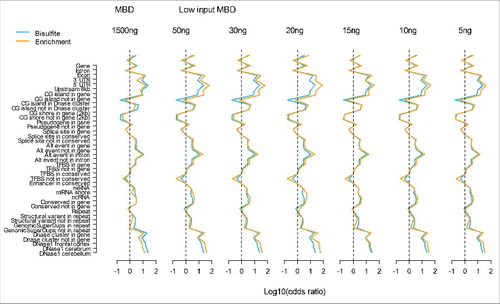
Figure 4. Methylation profiles across genomic features. The blue lines represent WGB-seq and the yellow lines MBD-seq enrichment profiles. The y-axis show the genomic feature tested and the x-axis the log10 of the odds ratio calculated from the 2 by 2 tables where loci were classified as methylated vs. non-methylated and genomic features as present vs. absent. The first plot shows results for our previously MBD-seq protocol (MBD) using 1500 ng starting material. The following plots involve the low starting material protocol (Low input MBD) with amount of input DNA of 50 ng, 30 ng, 20 ng, 15 ng, 10 ng, and 5 ng.