Figures & data
Figure 1. Establishment and characterization of a Gal4-Lsh tethering system. A. Schematic graph of a Lsh tethering system at murine Oct4 sites. The Oct4: GFP ES cell was developed in the Crabtree laboratory with one modified Oct4 allele harboring 5 Gal4 binding sites at the promoter region upstream of the EGFP reporter. We established a Lsh tethering system by ectopic expression of Gal4-Lsh in Oct4: GFP ES cells. B. Western analysis for detection of the Gal4-Lsh or Gal4 protein in Oct4: GFP ES cells transduced with Gal4-Lsh or Gal4 vectors using anti-Lsh antibody or Gal4 antibody. C. Detection of the nuclear location of Gal4-Lsh and Gal4 in Oct4: GFP ES cells by immune fluorescence analysis. Gal4-Lsh contains the flag epitope sequence between Gal4 and the Lsh protein and can be recognized by an anti-flag antibody. Nuclei were stained with DAPI. The controls were only stained with the secondary antibodies (right panel). D. ChIPs analysis followed by real-time PCR analysis to assess Gla4-Lsh or Gal4 enrichment at GFP or 3 kb upstream sequences in Gal4-Lsh or Gal4 expressing ES cell. The Gal4 immunoprecipitation signal at the 3 kb upstream region is not significantly increased compared with the IgG control. ChIPs results represent the mean ± SD of 3 independent samples. SD, standard deviation. *P < 0.05; **P < 0.01.
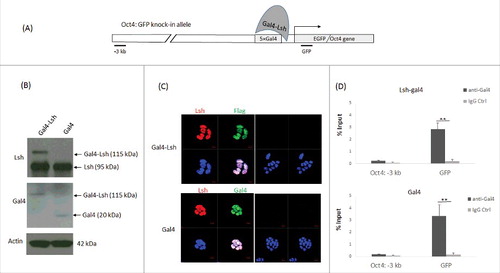
Figure 2. Association of Lsh at the Oct4 site represses GFP expression during ES differentiation. A-B. GFP expression was measured by flow cytometry analysis upon recruitment of Gal4-Lsh or Gal4 protein in Oct4: GFP ES cells before and after differentiation. Mouse ES cell without GFP knockin were used as the negative control. Flow cytometry results represents the mean ± SD n = 3, **P < 0.01. C-E. Determination of GFP mRNA and protein level in Gal4-Lsh or Gal4 expressing ES cell before and after RA treatment by fluorescence microscopy (C), real-time PCR (D) and western blot analysis (E). RT-PCR result represents the mean ± SD n = 4, *P < 0.05.
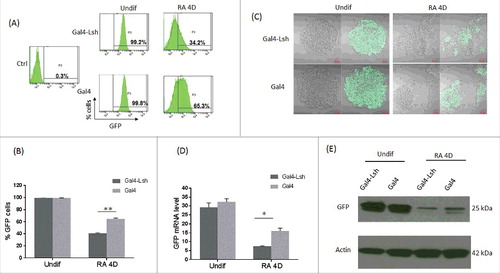
Figure 3. Lsh recruitment induces histone modification changes at the Oct4 locus. A. Regions analyzed by the ChIP assay are shown in the schematic graph. B-E. ChIPs analysis followed by real-time PCR analysis to assess H3K4m3 (B), H3K9m3 (C) and H3K27me3 (D) enrichment at 3 different regions in Gal4-Lsh or Gal4 ES cell before and after RA treatment. IgG antibody served as the ChIP control (E). The ChIP results represent the mean ± SD, n = 4. SD, standard deviation. *P < 0.05; **P < 0.01.
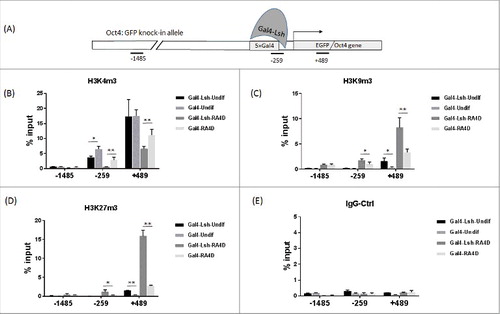
Figure 4. Lsh enhances nucleosome occupancy at the tethering site. A-B. Nucleosome occupancy (NO) was analyzed at the Oct4 enhancer, promoter region and GFP region in undifferentiated (A) and differentiated Gal4-Lsh and Gal4 expressing ES cells (B). Schematic graph indicates the locations of the distal enhancer (DE), proximal enhancer (PE), and proximal promoter (PP) and EGFP sequence of the Oct4: GFP allele. Arrow indicates the transcription start site. GpC methylation profiles were generated for Gal4-Lsh and Gal4 expressing ES cells. The green filled circles represent those GpC sites that are accessible to GpC methyltransferase, indicating nucleosome free region. Pink color areas represent the regions of inaccessibility that are large enough (> 147 bp) to accommodate a nucleosome. NO: Nucleosome Occupancy. Statistical test was performed for NO assay at indicated 507bp region in undifferentiated cells (P = 0.004, Gal4-Lsh Vs. Gal4).
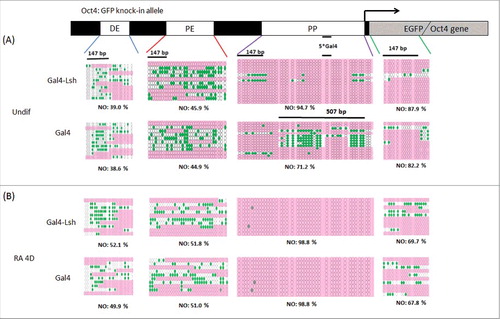
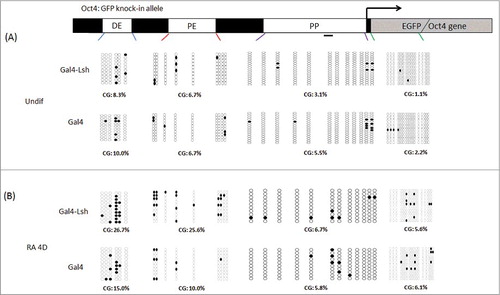
Figure 5. Lsh binding increases Oct4 enhancer DNA methylation after ES differentiation. A-B. Schematic graph representing CG methylation level at the Oct4 distal enhancer, proximal enhancer, proximal promoter and EGFP region which were analyzed by the bisulfite sequencing analysis of CpG sites in Gal4-Lsh or Gal4 expressing ES cell before (A) and after RA treatment (B). The CpG methylation profiles are shown with black filled (methylated) and white open (unmethylated) circles. Each sample includes at least 10 sequenced clones and is represented as percentage of methylated CpGs. Statistical test was performed for CG methylation assay at DE and PE sites in differentiated cells (Gal4-Lsh Vs. Gal4, DE, P = 0.177; PE, P = 0.011).