Figures & data
Figure 1. Quantifying 5hmC in human placenta and brain regions. (A) Venn diagrams illustrating the number of probes detected using the threshold Δβ > 0.1 and >0.2 after combined QC filtering for the three datasets. The figures represent the number of probes with an average greater than the threshold value in each tissue. (B) All probes classified according to their genomic location. The bar chart illustrates probe enrichment classified by Illumina Infinium annotation in placenta, frontal cortex and cerebellum. (C) Inclusion criteria for Bumphunter function with the number of probes contained within each 800 bp window.
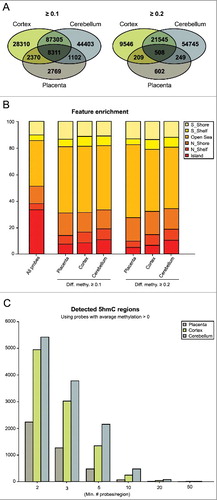
Figure 2. Characterization of 5hmC positive loci in placenta and brain. (A) Genomic interval overlapping the SEMA3B region on chromosome 3 showing the average distribution of 5hmC (green) and 5 mC (black) in placenta samples. The upper panel represents the enrichment defined by oxBS-450K analysis with dots signifying data points for each probe (5hmC Δβ; 5 mC oxBS) and the 95th confidence interval. The lower panel shows the corresponding hMeDIP enrichment in 4 control placenta samples. The Bumphunter-defined interval is highlighted as a yellow shaded region. (B) Overview of the T4 β-glucosyltransferase assay. (C) Quantitative PCR combined with T4-BGT assay targeting the SEMA3B promoter confirms enrichment of both 5hmC and 5 mC in placenta. (D) The distribution of 5hmC and 5 mC at the EHMT2 gene in cerebellum identified by oxBS-450K and Bumphunter analysis. (E) T4-BGT confirmation of 5hmC and 5 mC in frontal cerebellum -DNA. Error bars represent standard error of the mean (SEM) of three PCR replicates.
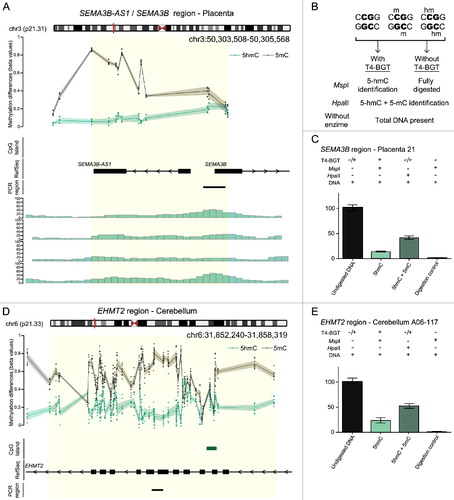
Figure 3. Enrichment of 5hmC overlapping imprinted DMRs. (A) The Bumphunter defined interval overlapping the GNAS A/B DMR showing the average distribution of h5mC (green) and 5 mC (black) in brain. The upper panels represents the enrichment defined by oxBS-450K analysis with dots signifying individual data points for each probe (5hmC Δβ; 5 mC oxBS) and the 95th confidence interval. Blue lines represent paternally expressed transcripts and red maternally expressed genes. (B) Analysis of allelic 5hmC and 5 mC using T4-BGT genotyping in cerebellum-derived DNA heterozygous for the variant rs6026578. The sequence trace of PCR amplicons generated using HpaII digested DNA (representing 5 mC+5hmC) and MspI T4-BGT (5hmC) PCRs are shown. (C) The Bumphunter defined interval overlapping the MCCC1 DMR in placenta. (D) Allelic enrichment of 5hmC and 5 mC confirmed using T4-BGT genotyping in a placenta sample heterozygous for the SNP rs937652. (E) Additional imprinted DMRs showing monoallelic enrichment of 5 mC and 5hmC in cerebellum (NNAT and NAP1L5) and placenta (SCIN, ACTL10, and H19) samples, respectively.
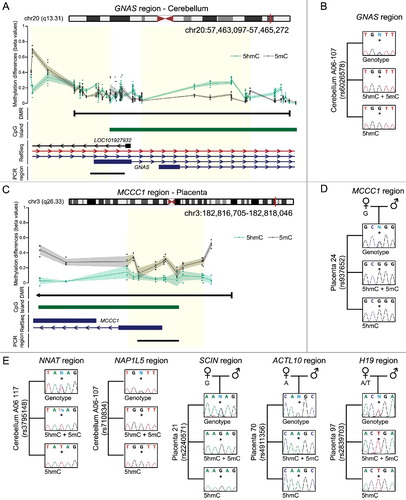
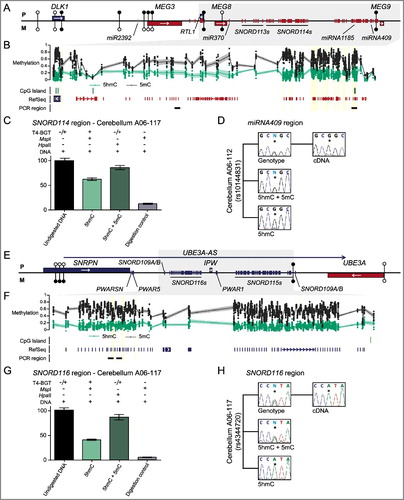
Figure 4. Enrichment of 5hmC overlapping imprinted SNORD-miRNA clusters. (A) A map of the DLK1-DIO3 imprinted domain on chromosome 14 revealing the location of the associated Bumphunter hits in frontal cortex. The location of the known genes and DMRs are shown. Blue lines represent paternally expressed transcripts and red lines maternally expressed genes. (B) The enrichment of methylation defined by oxBS-450K analysis with dots signifying individual data points for each probe (5hmC Δβ; 5 mC oxBS) and the 95th confidence interval. (C) Quantitative PCR combined with T4-BGT assays targeting the SNORD114 region reveals enrichment of 5hmC. Error bars represent SEM of three PCR replicates. (D) Analysis of allelic 5hmC and 5 mC using T4-BGT genotyping in cerebellum-derived DNA heterozygous for the variant rs10144831 reveals enrichment of 5 mC on both alleles consistent with the high 5 mC levels, whilst 5hmC is only observed on the expressed G allele. (E) A map of the SNRPN-UBE3A imprinted domain on chromosome 15. (F) The enrichment of methylation defined by oxBS-450K analysis with dots signifying individual data points for each probe (5hmC Δβ; 5 mC oxBS) and the 95th confidence interval. (G) Quantitative PCR combined with T4-BGT assays targeting the SNORD116 cluster reveals enrichment of 5hmC. Error bars represent SEM of three PCR replicates. (H) Analysis of allelic 5hmC and 5 mC using T4-BGT genotyping in cerebellum-derived DNA heterozygous for the variant rs4344720 reveals biallelic enrichment of 5 mC but monoallelic 5hmC on the expressed A allele.