Figures & data
Figure 1. H2afv expression successfully depleted by morpholino (MO) injection (A) RT-PCR using primers that detect both h2afva and h2afvb demonstrates high mRNA levels of expression across all stages of embryonic zebrafish development. (B) Whole mount immunofluorescence detects H2afv protein expression across stages of zebrafish embryonic development. Representative images from at least 5 embryos examined from 2 separate clutches are shown. (C) Western blot analysis demonstrates depletion of H2afv expression at 24 hpf in lysates from varying concentrations of h2afv MO injected embryos compared with control (uninjected) embryos. h2afv morphants (0.67 ng) were used for the rest of the study (marked*). Representative image of 2 different blots are shown. (D) Kaplan-Meier curve illustrates increased mortality of h2afv morphants compared with control (uninjected) embryos across 96 h post fertilization (hpf). MO injected at 3.3, 0.67 and 0.34 ng per embryo, n = number of clutches and number of total embryos analyzed per condition in parenthesis.
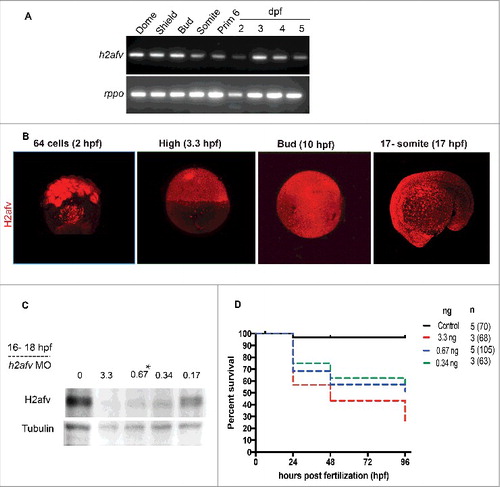
Figure 2. H2afv depletion causes significant phenotypic abnormality (A) Bright field images comparing Control (uninjected) and h2afv MO injected fish at 24 and 48 hpf, with the same embryo imaged at both time points. (B) Embryos were scored as Severe, Mild or Normal phenotype in a minimum of 5 clutches and displayed as percentages, with n = the number of total embryos and the number clutches analyzed per condition. (C) Western blot analysis of 24 hpf embryos demonstrates complete depletion of the H2afv protein in morphants exhibiting the severe phenotype and slight residual protein expression in h2afz morphants with mild phenotype while the control (uninjected) embryos express high levels of H2afv protein. (D) Bright field images of 48 hpf embryos injected with h2afv mRNA (50 ng), h2afv MO or h2afv mRNA plus h2afz MO. Phenotypic normality is restored in co-injected embryos. (E) Phenotype percentages of h2afv MO or h2afv mRNA injected with control morpholino-1 or with h2afz morpholino scored at 48 hpf. Scale bar: 1000 μm.
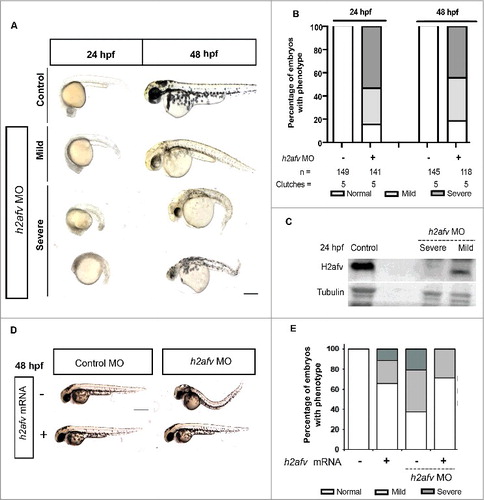
Figure 3. Differences in DNA methylation apparent in h2afv morphants at 15-17 somite stage (A) Genomic DNA was isolated from both control (uninjected) embryos h2afv morphants at 15-17 somite stage and levels of 5mC analyzed by slot blot. The morphants exhibit hypermethylation at this stage (n = 2) (B) Slot blot analysis for levels of methylated cytosine (5mC) analyzed at early stages of development. h2afv morphants exhibit hyper methylation at stages analyzed compared with control (standard morpholino control-1) embryos with statistically significant hyper methylation at the 15-17 somite stage corresponding to the complete loss of the H2afv protein in the morphants (C) Bulk DNA methylation of 15-17 somite embryos with h2afv depletion (MO) or over expressing h2afva-GFP RNA. Depletion results in an increase of 73% methylation (P < 0.0001) and overexpression results in a decrease to 85% methylation (P = 0.01), DNA methylation in control is depicted at 100% as a dotted line (n = 4). n = number of clutches.
Figure 4. Significant increase in gross hypermethylation of promoters in h2afv morphants, with both hyper- and hypo-methylation observed at base pair resolution (A) The number of CpGs sites detected in the RRBS experiment is illustrated by gene elements annotation with different colors. Methylated CpG site is defined as >75% aligned reads at this locus are methylated, while non-methylated CpG site is defined as <25% aligned reads at this locus are not methylated. (B) Common CpGs bases are those detected in both control and h2afv morphants (MO) with minimum coverage 5. Hypermethylated CpGs are higher in h2afv MO and Hypomethylated are lower in h2afv MO, while the difference of methylation at each CpG site is larger that 10%. Different gene elements are marked with color, respectively. * denotes P < 0.05 using the Chi-squared test (C) A hypermethylated region of chromosome 18 in epigenome browser view. In the top panel, methylation difference at common CpG sites between h2afv MO and control, increased methylation in h2afv MO is displayed in blue, and in red for the control. The individual panels below display the overall view of methylation in h2afv MO (in blue) and control (in red). The sequence and annotation are also represented in this panel.
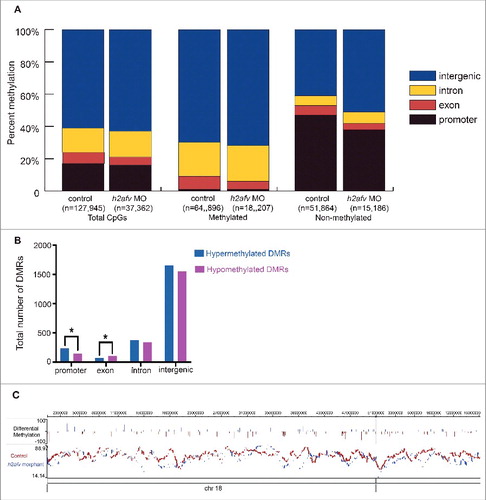
Table 1. Comparison of CpGs analyzed by RRBS and DMRs between control siblings and h2afv morphants at 13-15 somite stage. The methylation status of the CpGs (A) and differentially methylated regions (B) in controls and h2afv morphants. Hyper and hypomethylated DMRs reflect the change in methylation in h2afv morphants compared to controls.
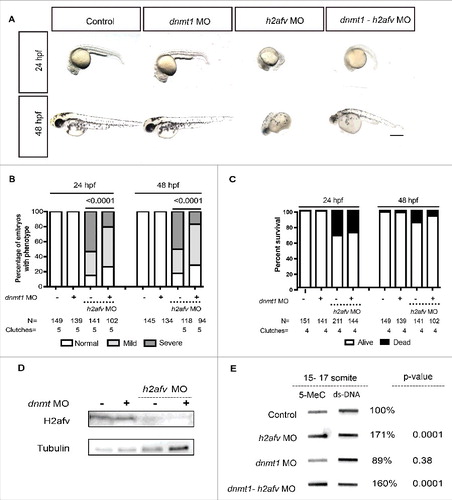
Figure 5. Co-injection of dnmt1 MO partially rescues the h2afv morphant phenotype (A) Bright field images comparing embryos injected with control morpholino-2 (0.67 ng) or with h2afv (0.67 ng), dnmt1 (0.43 ng) or dnmt1-h2afv co injected embryos exhibiting the severe phenotype at 24 and 48 hpf. The dnmt1 morphants do not exhibit any significant phenotype either at 24 hpf or 48 hpf (n = 5) (B) Phenotype scored in a minimum of 5 clutches as Severe, Mild or Normal and displayed as percentages show that the percentage of h2afv morphants exhibiting the severe phenotype is significantly reduced in a dnmt MO background. (C) Percent survival of h2afv morphants with and without addition of dnmt1 MO at 24 hpf and 48 hpf. The survival of the h2afv morphants is not significantly affected with knockdown of Dnmt1 protein (p-value between the dead vs. alive numbers of h2afv and dnmt1- h2afv double morphants at 24 hpf = 0.4855 and at 48 hpf = 0.05. (D) Western blot analysis of protein lysates of 16-18 hpf embryos demonstrates complete depletion of the H2afv protein in both h2afv morphants and dnmt1- h2afv morphants while the expression of H2afv protein is unaffected in control and dnmt1 morphant embryos (n = 2). (E) Slot blot analysis of 5-MeC levels using genomic DNA from control, h2afv morphants and dnmt1- h2afv morphants at 14-18 somite stage (16-18 hpf). The h2afv morphants exhibit significant hypermethylation and the inhibition of dnmt1 in this background does not have a significant effect on the global DNA hypermethylation. One way ANOVA was performed comparing each of the morphants with the uninjected controls. Number of clutches (n) = 4. Scale bar: 1000 μm.