Figures & data
Table 1. Characteristics of the study population.
Figure 1. Differential DNA methylation analysis in sibling pairs discordant for intrauterine exposure to maternal GDM. (A) Volcano plot for the differential DNA methylation analysis of the 465,446 CpG sites. The effect size of GDM exposure on DNA methylation levels at each of the CpG sites is shown in x axis and the significance levels are shown in y axis. Coefficients > 0 refer to increased methylation in the GDM group compared with the non-GDM group. (B) Heatmap of adjusted β values for the top 100 differentially methylated CpG sites associated with intrauterine exposure to maternal GDM. The 36 samples (column-wise) and 100 CpG sites (row-wise) associated with intrauterine exposure to GDM were displayed using unsupervised hierarchical clustering. The upper panel and the lower panel represent sibling pairs and group information (black: GDM group; gray: non-GDM group), respectively. Blue to red gradient correspond to increasing methylation. Manhattan distance measures were used to compute inter-sample distances based on DNA methylation levels. S1-S18 denotes sibling IDs and G and N represent the GDM group and the non-GDM group, respectively.
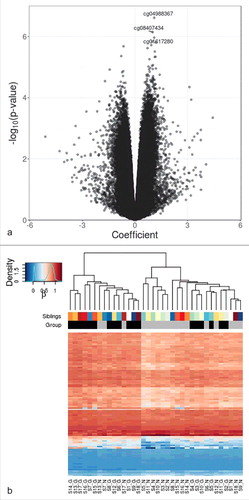
Table 2. Differential DNA methylation in siblings discordant for their exposure to maternal GDM (q < 0.15).
Table 3. Gene set enrichment analysis of genes associated with differentially methylated CpG sites.
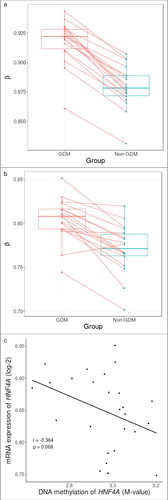
Figure 2. Within sibling pair comparison of DNA methylation levels at cg08407434 and HNF4A gene and correlation with mRNA expression. (A) Within sibling pair differences in covariate-adjusted β values (GDM – non-GDM) at cg08407434 show consistent increased methylation in siblings exposed to GDM. (B) Within sibling pair differences of covariate-adjusted overall methylation levels of all CpG sites across the HNF4A region also show a marginal trend of increased methylation in siblings exposed to GDM (P = 0.053). (C) Overall DNA methylation level of HNF4A showed a negative correlation with mRNA expression albeit non significant (Pearson's coefficient: -0.364, P = 0.068).