Figures & data
Figure 1. Multi-layered genomics analysis of SH-SY5Y and SH(15M) UBE3A siRNA knockdown reveals how altered UBE3A levels impact epigenomic patterns. (A) UBE3A protein levels quantified from Western blot in SH(15M) and SH-SY5Y for siRNA control and UBE3A knockdown relative to GAPDH (blot in Fig. S1). Labeled are the four comparison groups used for differential genomic analyses. Error bars represent the mean ± SEM of three replicates. Significance by 2-way ANOVA P < 0.0001. (B) Study design: following UBE3A siRNA knockdown and control treatment, each triplicate culture was harvested for DNA, RNA, or chromatin to assay DNA methylation, differentially expressed genes, or histone peaks, respectively. (C) Table outlining results of the genomic assays for each comparison group by UBE3A levels. Each of the four comparisons generated independent lists of genes that overlapped with differential marks from each of the genomic assays.
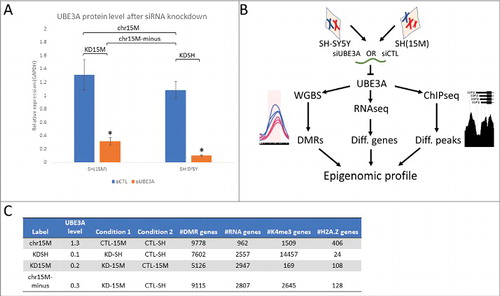
Table 1. Genomic datasets gene list overlaps.
Figure 2. Overlap of dataset gene lists shows effect of altered UBE3A levels on the epigenome. Size-dependent Venn diagrams show a graphical representation of the gene lists generated by each genomic assay for each comparison group. Circles indicate the relative number of genes for each dataset and show the level of overlap between datasets within each comparison group.
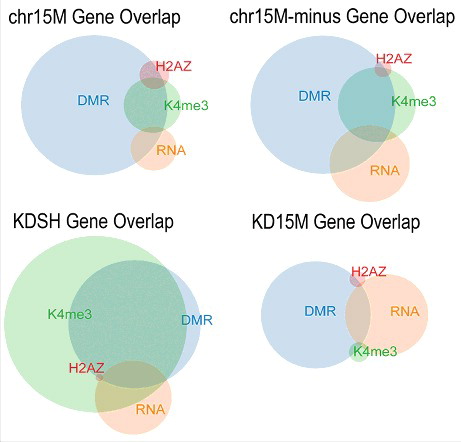
Figure 3. Gene Ontology enrichment reveals that UBE3A effects epigenetic regulation of neuronal development and imprinted genes. (A) GO enrichment heatmap for DMR-associated gene lists for each comparison group. Significance of term enrichment by FDR q-value for each group is indicated by colored key. (B) GO enrichment heatmap for differential H3K4me3-associated gene lists for chr15M, KDSH, and chr15M-minus comparison groups. Significance of term enrichment by FDR q-value for each group is indicated by colored key. (C) GO enrichment heatmap for differentially expressed genes for each comparison group. Significance of term enrichment by Bonferroni P value for each group is indicated by colored key. (D) GO enrichment for differential H2A.Z-associated genes in the chr15M comparison group. Significance of term enrichment by FDR q-value is represented by -log10 bar values. (E) GO enrichment for differential H2A.Z-associated genes in the KDSH comparison group. Significance of term enrichment by FDR q-value is represented by -log10 bar values.
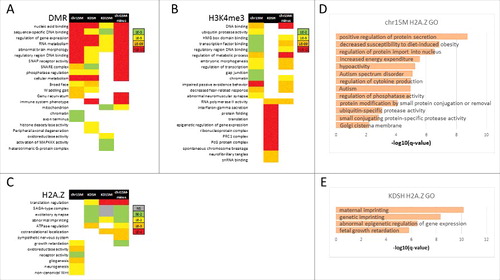
Table 2. Genomic datasets imprinted gene overlaps.
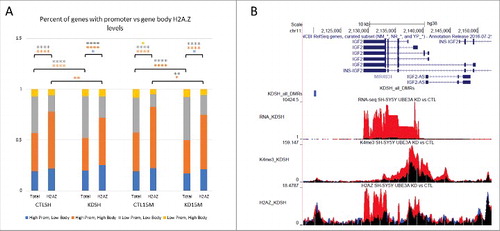
Figure 4. UBE3A knockdown in SH-SY5Y and SH(15M) changes H2A.Z promoter and gene body levels. (A) Percent of genes with high or low promoter H2A.Z and high or low gene body H2A.Z from quadrants in Figure S5. Percent of total genes and percent of genes with differential H2A.Z peaks are shown for each cell type and siRNA condition. Comparisons indicate significance of the change in number of genes following UBE3A knockdown by Fisher's exact test. (* P < 0.01, ** P < 0.001, **** P ≅ 0) (B) Representative UCSC Genome Browser snapshot of IGF2 showing tracks of each genomic dataset and highlighting increase of H2A.Z at imprinted genes.