Figures & data
Figure 1. Expression of H3.3K36M depletes global di- and tri- methylation at H3K36 but recapitulates loss of H3K36me2 in cell proliferation (A) Western blot analysis lysates from HT1080 cells stably expressing H3.3 wild-type or K36M, using the indicated antibodies. Arrowhead, FLAG-H3.3 fusion construct appears as a higher molecular weight band than endogenous H3. (B) Western blot analysis of lysates from HT1080 cells stably expressing shNSD2 or control (sh ctrl) probed with anti-NSD2 or anti-H3 as a loading control. (C) Real-time PCR of SETD2 mRNA expression from RNA extracted from HT1080 cells stably expressing shSETD2 or sh ctrl. (D) Western blot analysis of H3K36 methylation levels in lysates from HT1080 cells stably expressing FLAG-H3.3 K36M mutant or KMT shRNA knockdown, using the indicated antibodies. Arrowhead, as in (A). (E-G) Proliferation assays of cells from (D), showing growth of cells expressing shNSD2 compared to control shRNA in (E), shSETD2 compared to control shRNA in (F), and H3.3K36M compared to H3.3WT control in (G). Cells were maintained in selection media and counted every two days for the duration of the assay. Error bars indicate s.e.m. from three experiments. p-values were calculated using a two-tailed Student's t test. *, p < 0.05. **, p < 0.01. n.s., not significant.
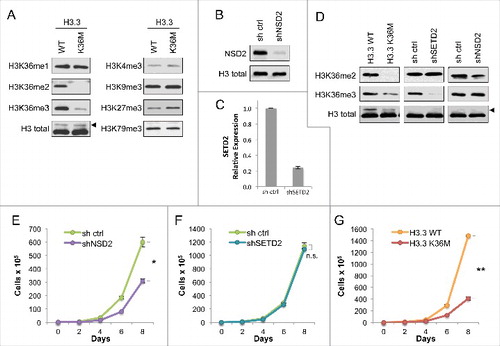
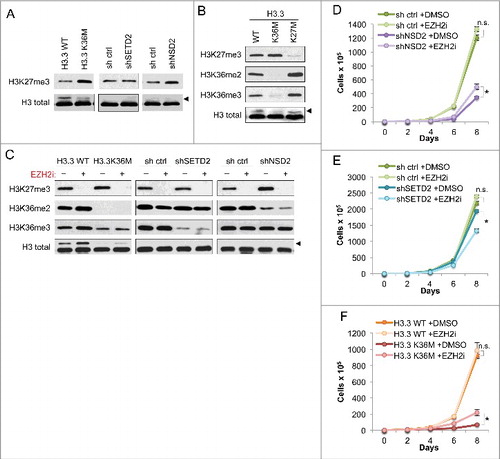
Figure 2. Growth impairment of H3K36me2-depleted cells is independent of antagonistic crosstalk between H3K36 and H3K27 methylation (A) Western blot analysis of H3K27me3 levels in lysates from the HT1080 cells from . Arrowhead, FLAG-H3.3 fusion construct appears as a higher molecular weight band than endogenous H3. (B) Western blot analysis of lysates from HT1080 cells stably expressing FLAG-H3.3 wild-type or mutant constructs, using the indicated antibodies. Arrowhead, as in (A). (C) Western blot analysis of lysates from HT1080 cells from under EZH2i or DMSO vehicle treatment, using the indicated antibodies. EZH2i, GSK126 small molecule inhibitor against EZH2. Arrowhead, as in (A). (D-F) Proliferation assays of the indicated cell lines treated with EZH2i or DMSO vehicle, showing growth of cells expressing shNSD2 with control shRNA in (D), shSETD2 and control shRNA in (E), and H3.3 K36M and H3.3 WT control in (F). Cells were maintained in selection media with drug or vehicle as indicated and counted every two days for the duration of the assay. Error bars indicate s.e.m. from three experiments. p-values were calculated using a two-tailed Student's t test. *, p < 0.05. n.s., not significant.