Figures & data
Figure 1. TSA treatment results in chromatin rearrangement. (a) Immunofluorescence analysis of MeCP2 and acetylated H4 distribution in NIH/3T3 cells +TSA and -TSA. Scale bars: 10 μm. (b) Time course microccocal nuclease digestion and (c) Western blot analysis of several histone PTMs before and after TSA treatment of the same cells. “100 bp” corresponds to a 100 bp marker. SI, SE, and P represent the chromatin fractions obtained upon micrococcal nuclease digestion as described in 3.
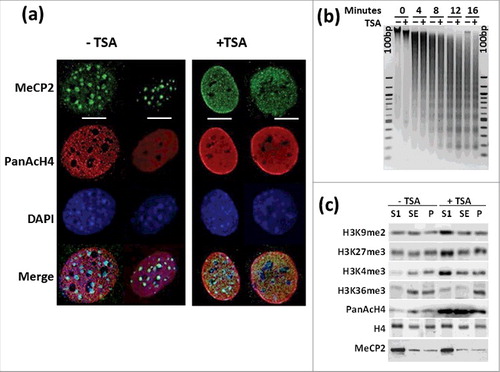
Figure 2. FRAP analysis of NIH/3T3 cells. (a) Untransfected NIH/3T3 cells in the presence (red)/absence (orange) of DMSO controls or transfected with GFP-MeCP2 (blue). (a) Green fluorescence analysis of the distribution of chromobox homolog (CBX5) in the nuclei used for the analyses shown in (a), with (+) or without (−) TSA treatment. Scale bar: 10 μm.
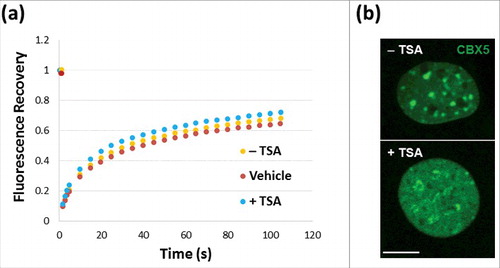
Figure 3. TSA treatment affects the binding of MeCP2 to chromatin. Salt (NaCl) extraction of MeCP2 from nuclei of untreated (orange line) and TSA treated (blue line) NIH/3T3 cells. Quantitative western blots were carried out on n = 2 independent experiments. MeCP2 levels were measured in both supernatant and pellet fractions, given that the reciprocal increase and decrease of MeCP2 represent the unbound (released) and bound fractions from cell nuclei, respectively. Data presented as mean ± SEM.
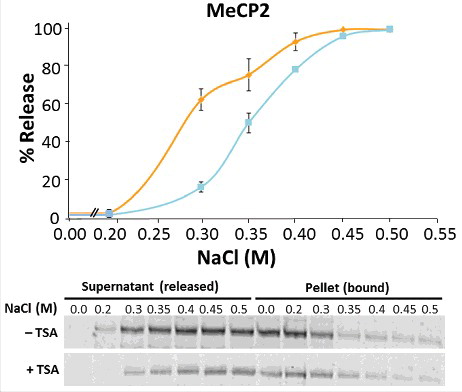
Figure 4. TSA exposure alters the levels of MeCP2 phosphorylation. Changes in the levels of MeCP2 phosphorylation at positions S80, S164, and S421, normalized to total MeCP2, both without (−) and with (+) exposure to TSA. Equal loadings of total MeCP2 (in control and treated samples) were used so that changes in the phosphorylated forms could be visualized. Westerns for total MeCP2 and each one of the corresponding phosphorylated forms were obtained from the same gel (membrane). Data represents mean ± SEM of 4 independent experiments. Mann-Whitney tests were used to calculate significance; * P value <0.05, **P value <0.01, ***P value <0.001. Representative blot images are shown in greyscale black on white format.
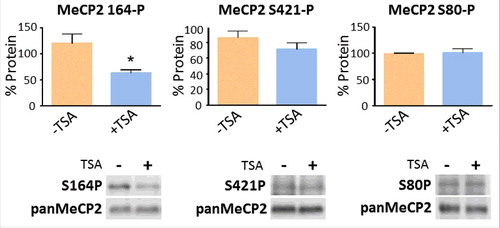
Figure 5. TSA decreases the levels of MeCP2 in different cell lines. (a) Comparison of the effects of TSA (330 nM) treatment for 24 h. on the levels of MeCP2 and histone H4 acetylation in NIH/3T3 mouse fibroblasts. (b) Effects of TSA treatment on HeLa S3 [40 ng/mL (132 nM), 12 h] and HEK293 [120 ng/mL (396 nM), 18 h]. Representative WB bands shown to be disconnected were non-adjacent signals visualized on the same membrane. (c) Quantification of MeCP2 transcripts by real-time RT-PCR of NIH/3T3 cells with and without TSA treatment. Data presented as mean ± SEM of 3–11 experiments. Unpaired two tailed t-tests were used for large sample sizes wherein normal distribution could be validated (using Shapiro-Wilk test) and Mann-Whitney tests were used for small sample sizes. * P value <0.05, **P value <0.01, ***P value <0.001. Representative blot images are shown in greyscale black on white format.
![Figure 5. TSA decreases the levels of MeCP2 in different cell lines. (a) Comparison of the effects of TSA (330 nM) treatment for 24 h. on the levels of MeCP2 and histone H4 acetylation in NIH/3T3 mouse fibroblasts. (b) Effects of TSA treatment on HeLa S3 [40 ng/mL (132 nM), 12 h] and HEK293 [120 ng/mL (396 nM), 18 h]. Representative WB bands shown to be disconnected were non-adjacent signals visualized on the same membrane. (c) Quantification of MeCP2 transcripts by real-time RT-PCR of NIH/3T3 cells with and without TSA treatment. Data presented as mean ± SEM of 3–11 experiments. Unpaired two tailed t-tests were used for large sample sizes wherein normal distribution could be validated (using Shapiro-Wilk test) and Mann-Whitney tests were used for small sample sizes. * P value <0.05, **P value <0.01, ***P value <0.001. Representative blot images are shown in greyscale black on white format.](/cms/asset/8c248322-da9b-4db1-8203-78ed5ab6ba59/kepi_a_1380760_f0005_oc.jpg)
Figure 6. TSA treatment increases miR132 levels and affects MeCP2 protein levels in NIH/3T3 cells (a) Unprocessed pri-miR132/212 and mature miR132 transcription increases in TSA treated NIH/3T3 cells. Values were collected via quantitative RT-PCR. Data presented as mean ± SEM of 3–5 independent experiments. Mann-Whitney tests were used to calculate significance; * P value <0.05, **P value <0.01, ***P value <0.001. (b) Densitometric analysis and representative WB showing MeCP2 protein levels after transfection of NIH/3T3 with an LNA oligonucleotide against miR132 MRE located in the 3′UTR of MeCP2 mRNA and a LNA oligonucleotide control upon TSA treatment.
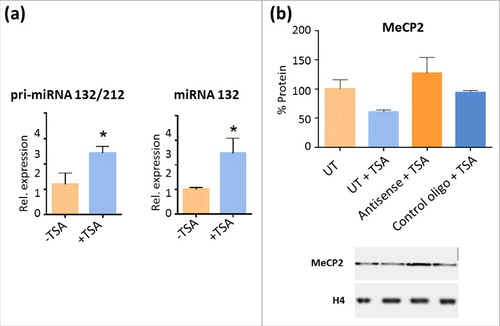
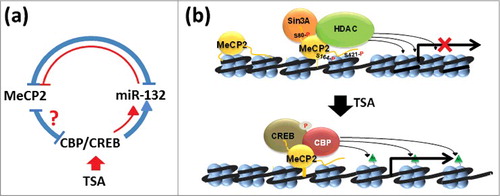
Figure 7. Model representation of the effects of HDAC inhibitors (TSA) on MeCP2 metabolism. (a) In the brain, MeCP2 expression is regulated by a complex regulatory loop 94 (shown in blue; see text for a detailed description). In red we are highlighting the regions of this network that we have been able to confirm in NIH/3T3 non-neuronal cells. (b) Based on early models of MeCP2 function, interaction of MeCP2 with an HDAC-Sin3A complex results in deacetylation of histones on surrounding nucleosomes leading to chromatin organization repressive to transcription 51. Under physiological conditions, MeCP2 is phosphorylated at several residues (S80),72 (S164),66, 72 and (S421)65 that fine-tune its transcriptional regulatory nature67, 71. Upon exposure to HDAC inhibitors such as TSA, the levels of MeCP2 phosphorylation decrease and so do the levels of the protein itself. This decrease is likely mediated by the action of CREB-CBP binding to MeCP2, which, upon acetylation of the neighboring nucleosomes (green triangles), creates a relaxed/transcriptionally-permissive chromatin organization that enhances transcription of miR132/212 4 and creates a regulatory loop of MeCP2 expression,43 shown in (a).