Figures & data
Figure 1. LXN, a tissue-specific gene within a constitutively expressed gene, displays specific promoter repression and DNA hypermethylation but not repressive chromatin in Mb. (a) RefSeq gene structure [Citation34] for LXN and GFM1 (hg19, chr3:158,358,796-158,412,265) and statistically significant myogenic hypermethylated DMRs as determined by RRBS [Citation27]. (b) 18-State chromatin segmentation from RoadMap [Citation23,Citation34]. Prom, promoter; Enh, enhancer; Enh/Prom, both active promoter-type and enhancer-type histone modifications; Txn-chrom, actively transcribed type of chromatin; Repressed, enriched in H3K27me3 (weak, light gray; strong, dark gray) or H3K9me3 (violet). (c) CpG islands and examples of some of the RRBS DNA methylation data tracks with a key for the 11-state, semi-continuous color code [Citation27]. (d) Bisulfite-seq profiles with blue bars indicating regions with significantly lower methylation compared to the rest of the given genome [Citation23,Citation78]. (e) CTCF binding from ChIP-seq profiles. (f) Strand-specific RNA-seq profiles. Expr, expression; repr, repression; fib, fibroblasts; osteob, osteoblasts; PFC, prefrontal cortex; sm intes, small intestine. Blue highlighting, the region of myogenic or SkM DNA hypermethylation at the TSS.
![Figure 1. LXN, a tissue-specific gene within a constitutively expressed gene, displays specific promoter repression and DNA hypermethylation but not repressive chromatin in Mb. (a) RefSeq gene structure [Citation34] for LXN and GFM1 (hg19, chr3:158,358,796-158,412,265) and statistically significant myogenic hypermethylated DMRs as determined by RRBS [Citation27]. (b) 18-State chromatin segmentation from RoadMap [Citation23,Citation34]. Prom, promoter; Enh, enhancer; Enh/Prom, both active promoter-type and enhancer-type histone modifications; Txn-chrom, actively transcribed type of chromatin; Repressed, enriched in H3K27me3 (weak, light gray; strong, dark gray) or H3K9me3 (violet). (c) CpG islands and examples of some of the RRBS DNA methylation data tracks with a key for the 11-state, semi-continuous color code [Citation27]. (d) Bisulfite-seq profiles with blue bars indicating regions with significantly lower methylation compared to the rest of the given genome [Citation23,Citation78]. (e) CTCF binding from ChIP-seq profiles. (f) Strand-specific RNA-seq profiles. Expr, expression; repr, repression; fib, fibroblasts; osteob, osteoblasts; PFC, prefrontal cortex; sm intes, small intestine. Blue highlighting, the region of myogenic or SkM DNA hypermethylation at the TSS.](/cms/asset/3eda686d-ff7b-4648-b21b-81fe1aa31987/kepi_a_1445900_f0001_oc.jpg)
Figure 2. Cardiac TF-encoding NKX2-5 is repressed in many samples without DNA methylation but is repressed with DNA methylation in Mb, SkM, and aorta at a cryptic super-enhancer. (a) RefSeq structure for NKX2-5 and Mb-hypermethylated DMRs (chr5:172,654,786-172,675,423). (b) Chromatin state segmentation as in with the addition that aqua green segments denote enrichment in repressive H3K9me3 with low levels of H3K36me3 [Citation23]. (c) CpG islands, CpGs, and examples of RRBS tracks for normal cell cultures and the HepG2 liver cancer cell line. (d) Bisulfite-seq profiles as in with additional bisulfite-seq tracks for other samples (shown in the dense configuration) to indicate the consistency of the SkM- and aorta-specific hypermethylation among replicates. (e) Enrichment in H3K27ac from peak-calling using MACSv2 with a P value threshold of 0.01 [Citation34] to illustrate that several of the hypermethylated SkM DMRs overlap especially strong enhancer regions. (f) RNA-seq. Esoph, esophagus; CpG density, plot of CpGs. Blue highlighting, Mb or SkM hypermethylated regions.
![Figure 2. Cardiac TF-encoding NKX2-5 is repressed in many samples without DNA methylation but is repressed with DNA methylation in Mb, SkM, and aorta at a cryptic super-enhancer. (a) RefSeq structure for NKX2-5 and Mb-hypermethylated DMRs (chr5:172,654,786-172,675,423). (b) Chromatin state segmentation as in Figure 1 with the addition that aqua green segments denote enrichment in repressive H3K9me3 with low levels of H3K36me3 [Citation23]. (c) CpG islands, CpGs, and examples of RRBS tracks for normal cell cultures and the HepG2 liver cancer cell line. (d) Bisulfite-seq profiles as in Figure 1 with additional bisulfite-seq tracks for other samples (shown in the dense configuration) to indicate the consistency of the SkM- and aorta-specific hypermethylation among replicates. (e) Enrichment in H3K27ac from peak-calling using MACSv2 with a P value threshold of 0.01 [Citation34] to illustrate that several of the hypermethylated SkM DMRs overlap especially strong enhancer regions. (f) RNA-seq. Esoph, esophagus; CpG density, plot of CpGs. Blue highlighting, Mb or SkM hypermethylated regions.](/cms/asset/0d67a797-6aeb-4ec9-a01d-bbbbb11d659f/kepi_a_1445900_f0002_oc.jpg)
Figure 3. Summary of the associations with transcription for the 94 Mb-hypermethylated genes. Number of genes found to correspond to each of the given categories of hypermethylation-transcription correlations as described in the text and in Supplementary Tables S1–S4. Light blue, the gene was associated with a Mb-hypermethylated DMR that displayed enhancer chromatin and a lack of DNA methylation in at least one non-myogenic cell type or tissue. Note that genes with alternate or cryptic promoters sometimes also fell into one of the first three categories.
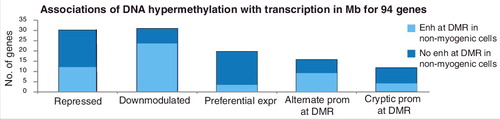
Figure 4. NR2F2, which encodes a master TF regulator, is down-modulated in Mb, SkM, aorta, epidermis, and mammary epithelial cells, and displays hypermethylated DMRs in those samples. (a) RefSeq or ENSEMBL structures for NR2F2, the 5’ end of NR2F-AS1, other ncRNA genes; Mb-hypermethylated DMRs (chr15:96,808,300-96,911,119). (b) Chromatin state segmentation. Broken arrows, locations of two of the alternative TSS for NR2F2; orange triangles, gaps in promoter chromatin that correspond to the SkM-hypermethylated DMRs. (c), (d), (e), and (f), as described for . In (d), the locations of two of the alternative TSS for NR2F2, a constitutive CTCF binding site, and hypermethylated DMRs are indicated above the SkM track. Dotted boxes, two of the super-enhancer regions that show very low levels of DNA methylation. Pink horizontal line for lung fibroblasts in (d) and (e), the region of high DNA methylation and low H3K27ac at the super-enhancer in these cells.
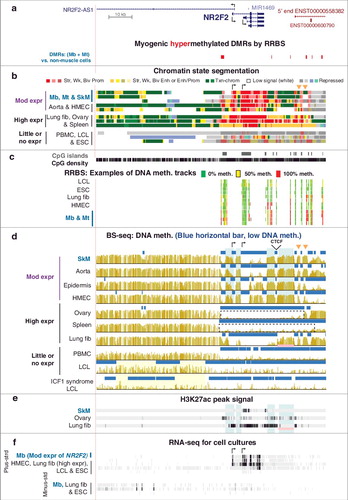
Figure 5. The homeobox gene EN1 is expressed preferentially in Mb, SkM, and epidermis and has TSS-upstream and gene-downstream hypermethylation in those samples. (a) RefSeq or ENSEMBL structures for EN1 and ncRNA genes; Mb-hypermethylated DMRs (chr2:119,587,322-119,618,802). (b), (c), (d), and (e), as described for . The orange broken arrow indicates the CAGE-determined Mb TSS.
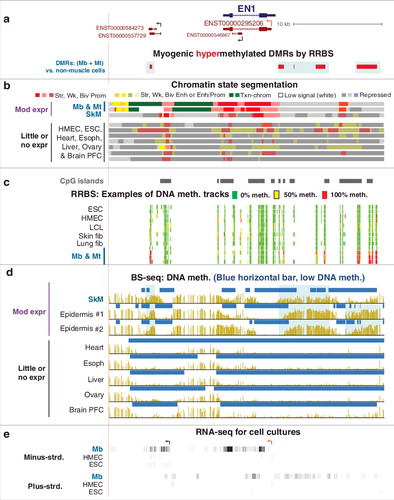
Figure 6. Schematic showing featured relationships between hypermethylated DMRs, chromatin state, and transcription of the associated mRNA-encoding genes for the 94 examined Mb-hypermethylated genes. The association of alternative splicing with DNA methylation is not included although four of the 94 genes gave some evidence for a correlation between tissue- or cell type-specific DNA hypermethylation and alternative use of splice isoforms (Supplementary Table S4a). Hypermeth, hypermethylation; txn, transcription; enh, enhancer; prom, promoter; PcG-chrom, chromatin enriched in repressive H3K27me3; adj, adjacent; lincRNA, long intergenic noncoding RNA; downreg, downregulation; elongn, elongation; “at CTCF sites” includes sites near but not within the consensus CTCF binding sequence.