Figures & data
Figure 1. Principal component analysis (PCA) from (A) normalized DNA methylation (M-values) and (B) log2 transformed gene expression data. Normal samples are shown in purple and tumor samples in green. Samples clustering within the other group (separated by the dashed line) were labeled with their sample ID. C: The number of significantly differentially methylated CpG sites (Δβ >0.1 and FDR <0.001) ordered according to location and their island relation (hyper- and hypo-methylation in CRC compared to normal tissues). D: The number of significantly differentially regulated genes (log2FC >0.5 and FDR <0.01) between CRC and normal tissues (up- and down-regulation in CRC). E: Overlap between differential methylation (≥2 CpGs significantly methylated per gene) and significant gene regulation.
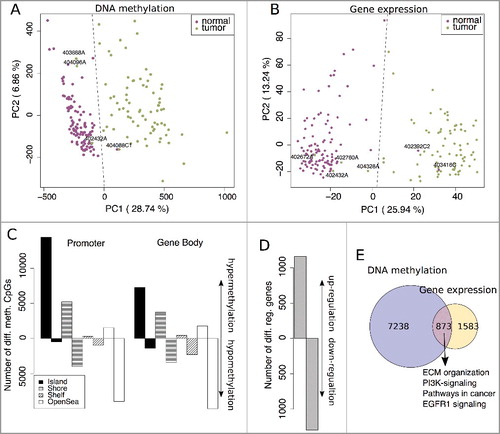
Figure 2. Proportions of hyper- and hypo-methylated regions that display a significant relationship (FDR corrected P value <0.05 and |ϱ| >0.2) to gene expression for the promoter (A) and the gene body (B). C: Methylation pattern of all genes (8491) that contain at least one methylation region that is significantly correlated to its gene expression values.
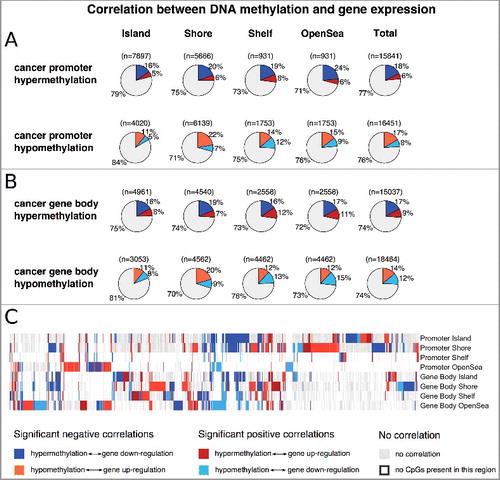
Figure 3. A: Workflow of training Random Forest classification models on different subsets of genes. Prediction performances (AUCs) obtained from three times repeated 10-fold cross-validation for different subsets of genes according to log2FC and Spearman correlation coefficients thresholds. Below, the importance of predictors across all prediction models are shown (scaled between [0, 1]). B: Subsets of negatively and positively correlated genes C: subsets of negatively correlated genes and D: Subsets of positively correlated genes.
![Figure 3. A: Workflow of training Random Forest classification models on different subsets of genes. Prediction performances (AUCs) obtained from three times repeated 10-fold cross-validation for different subsets of genes according to log2FC and Spearman correlation coefficients thresholds. Below, the importance of predictors across all prediction models are shown (scaled between [0, 1]). B: Subsets of negatively and positively correlated genes C: subsets of negatively correlated genes and D: Subsets of positively correlated genes.](/cms/asset/5e9f50db-b187-4805-9563-11a18afd3195/kepi_a_1460034_f0003_oc.jpg)
Figure 4. A: Left panel: Heatmap of methylation profiles (Δβ values) for all genes from the subsets of negatively (327) and positively (129) correlated genes (see C and D; black boxes) with regard to their regulation, prediction outcome and prediction model association. The black box represents an example of gene-specific regulation (up and down) from similar methylation patterns. Right panel: detailed view of 84 cancer associated genes (cancer genes from Bushman's Lab, Suppl. Table 2) and their associated function in cancer. B: Significantly enriched consensus pathways (P value <0.05) in negatively correlated (purple nodes), positively correlated (grey nodes), and both (yellow nodes) genes. Edges are drawn if pathways share 30% of their genes. Node and font size are proportional to the size of the gene sets.
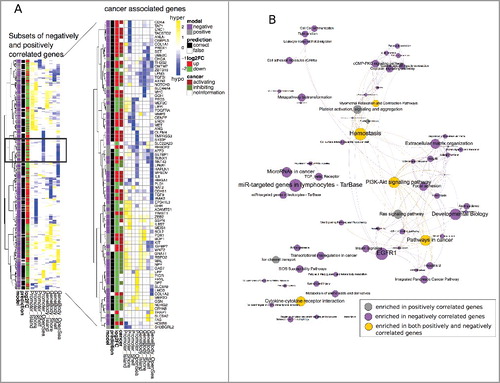
Figure 5. A: ROC curves of validation analysis of the prediction models for negative correlated (solid line) and positive correlated (dashed line) genes in independent CRC methylation (meth) and gene expression (exp) data. B: Average of gene regulation prediction performances (AUC) and their standard deviation for 16 individual CRC patients from TCGA repository.
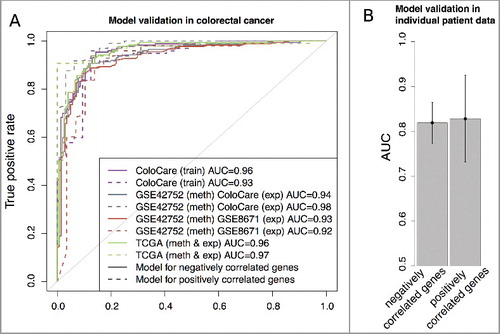
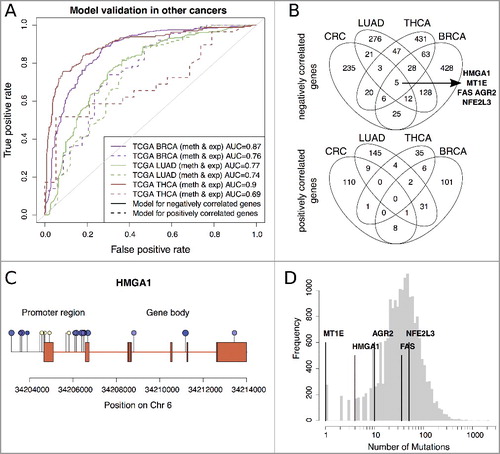
Figure 6. A: ROC curves of validation analysis of the prediction models for negative correlated (solid line) and positive correlated (dashed line) genes in BRCA, LUAD, and THCA data. B: Overlap between the subsets of genes of negatively and positively correlated genes used in the prediction models of CRC, BRCA, LUAD and THCA (see ROC curves A). C: Illumina 450K methylation profile on the HMGA1 gene. Hypermethylated CpGs in cancer tissues are shown in yellow and hypomethylated CpGs in blue. The size of the methylation sites corresponds to the significance of the Spearman correlation coefficient between HMGA1 gene expression and methylation levels at the respective loci. D: Mutational frequencies of HMGA1, MT1E, AGR2, FAS, and NFE2L3 across more than 9000 cancer patients from TCGA.