Figures & data
Figure 1. Number of published studies that focus on salivary DNA methylation in PubMed search from 2000 to 2016. (A) Total number of published studies. (B) Published studies by discipline.
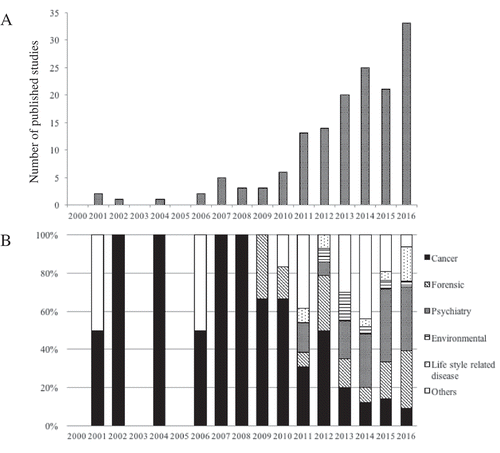
Figure 2. Comparison of quantification methods for DNA extracted from saliva. (A) Scatterplots showing the significant positive relationship between spectrophotometry and spectrofluorimetry measurements. (B) Concentration differs by the method of measurement. n = 128. Bar represents standard error (SE). **** represents P < 0.001.
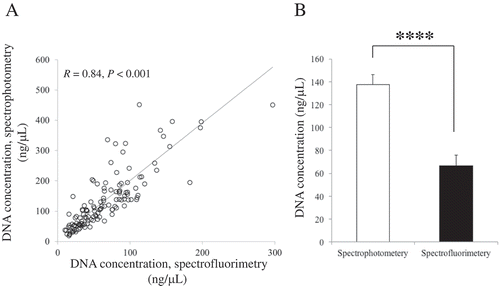
Table 1. Representative concentrations of BSC DNA measured by two different methods. DNA from a reference sample was used to limit bias due to variations in DNA quality.
Figure 3. Comparison of the quantification methods after BSC. (A) UV spectra of different amounts of DNA used to BSC. (B) The concentrations of different amounts of DNA used to BSC. (C) UV spectra of 0 ng, 50 ng and 100 ng DNA used to BSC with or without using carrier RNA. (D) The concentrations of 0 ng, 50 ng, and 100 ng DNA used to BSC with or without using carrier RNA.
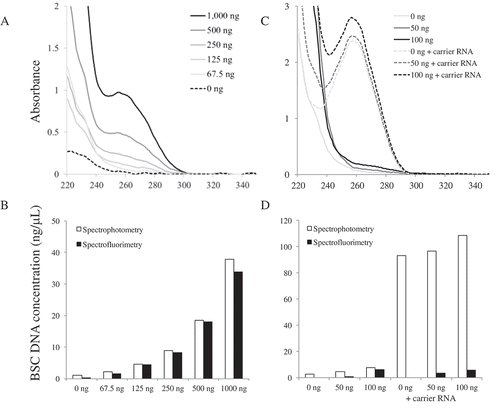
Figure 4. Distribution of percent yield of BSC DNA/dsDNA. X-axis indicates the distribution categories of percent yield and Y-axis indicates the number of subjects in each category.
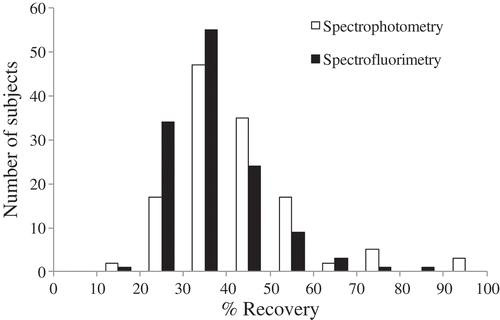
Table 2. Comparison of the total DNA yield following BSC based on the addition of carrier RNA. Quantifications vary based on the method used (spectrophotometry or spectrofluorimetry), and the presence of carrier RNA. Note that spectrophotometer was blanked with elution buffer from the BSC kit.
Figure 5. PCR amplification of OXTR MT2. (A) Linear association between unmethylated (0%), 25%, 50%, 75%, and 100% methylated samples across the target region in the EpiTYPER assay, 2 CpG sites were excluded due to technical issues. Each standard was run in triplicate. The error bars are indicative of standard error (SE). (B) Histogram for mean values across the target region in the EpiTYPER assay of normal adult samples (n = 128) .
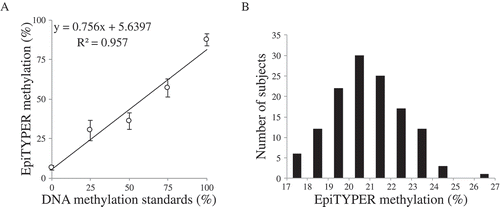
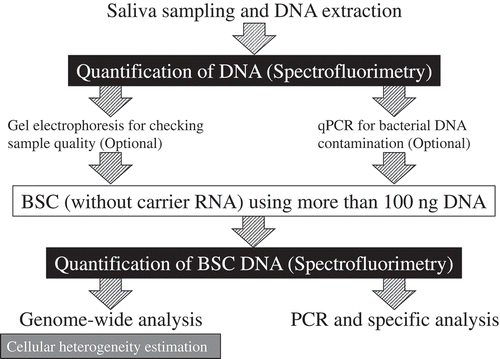
Figure 6. Summary of the recommendations for salivary DNA methylation analysis.