
Figures & data
Figure 1. Volcano plots of methylation difference for methylation datasets (GSE33202, GSE250932) and expression difference for expression datasets (GSE23036, GSE58911).
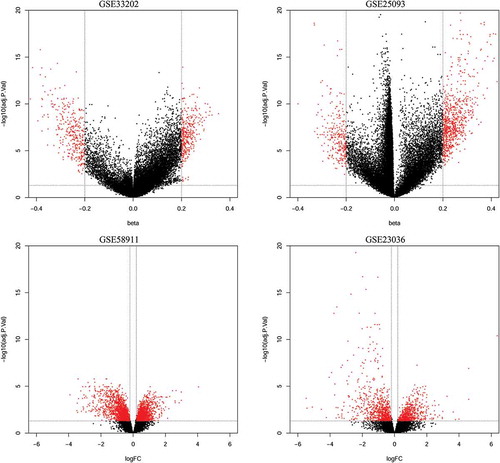
Table 1. The hypermethylated-low expression and hypomethylated-high expression genes validated by TCGA database.
Figure 2. Identification of aberrantly methylated-differentially expressed genes within gene expression datasets (GSE23036, GSE58911) and gene methylation datasets (GSE33202, GSE250932). a: Hypermethylated and downregulated genes. b: Hypomethylated and upregulated genes.
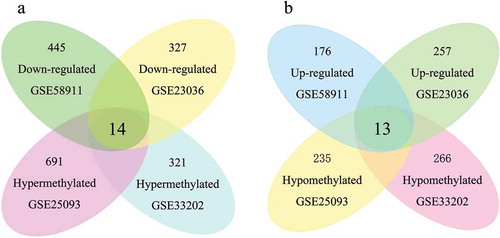
Figure 3. Heatmap of all included datasets and of the two series of hub genes. A: Heatmap of all the DMGs of methylation datasets (GSE33202, GSE250932) and the DEGs of expression datasets (GSE23036, GSE58911). B: Heatmap of the two series of hub genes identified in our study.
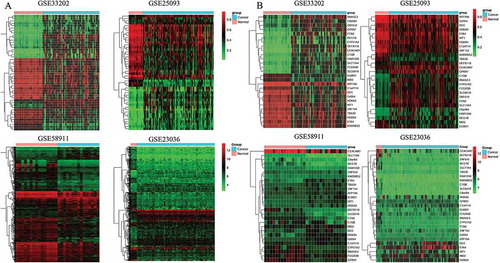
Figure 4. Six downregulated (DEFB118, FAM135B, CYP21A2, ZNF610, FCN2, and CEACAM7) and six upregulated (NID2, HOXA9, DCC, TBX20, WT1, and GATA4) genes confirmed by TCGA cohort.
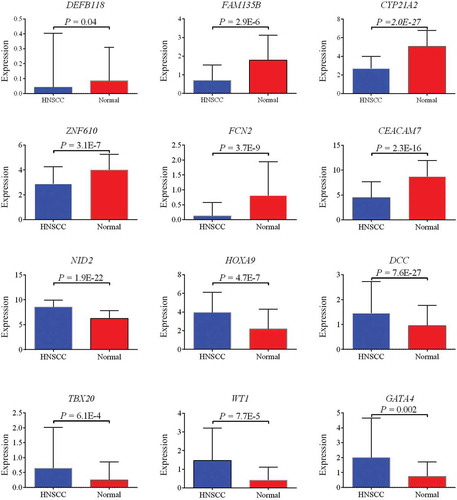
Figure 5. Two hypermethylated genes (FAM135B, ZNF610) and two hypomethylated genes (HOXA9, DCC) confirmed by TCGA cohort.
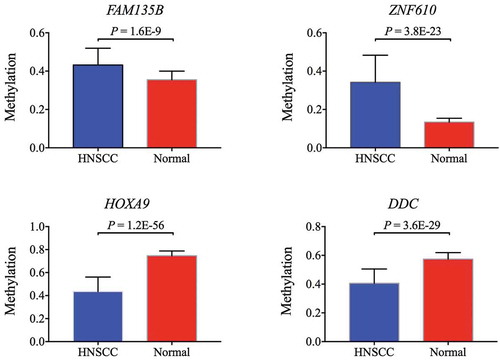
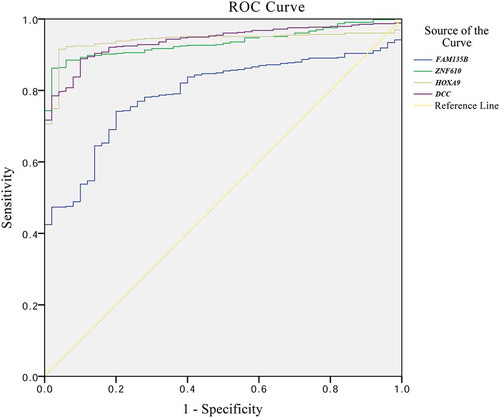
Table 2. Sensitivity and specificity of methylated genes for diagnosis of HNSCC.
Table 3. Prognostic value of methylated genes for HNSCC.
Figure 6. Receiver operating characteristic (ROC) curve and survival curves of four validated genes (FAM135B, ZNF610, HOXA9, and DCC) in TCGA.