Figures & data
Figure 1. Development of monoclonal antibodies that specifically recognize H4K5acK8ac. (A) ELISA assay for 2A7D9 antibody. Histone H4 protein containing indicated site-specific acetyllysine(s) are used as antigens. (B) Specificity analysis of 2A7D9 antibody using modified histone peptide array. Histone H4 peptides containing both K5ac and K8ac are indicated in the bottom panel. (C) Crystal structure of the 2A7D9 Fab fragment in complex with K5/K8-diacetylated histone H4 (1–12) peptide. Heavy and light chains are depicted in cyan and green, respectively. The K5/K8-diacetylated H4 peptide is shown in a yellow stick. (D) Close-up view of the 2A7D9 Fab fragment in complex with the H4 peptide. Carbon atoms of VH and VL chains are shown in cyan and green, respectively. Carbon atoms of acetyllysines positioned at 5 and 8 in the K5/K8-diacetylated H4 peptide are shown in yellow. All the nitrogen and oxygen atoms are shown in blue and red, respectively. Hydrogen bonds are indicated as dotted lines with linear distances (Å). (E and F) Close-up view of the complex around the 54th residue of VH chain. (E) 1A9D7 antibody, (F) 2A7D9 antibody. In (E) and (F), N- and C-terminus of the K5/K8-diacetylated H4 peptide is shown as red label of N and C, respectively. Glutamic acid at 54th position (E) and alanine at 54th position (F) is shown in magenta. In (F), asparagine 52 and threonine 53 are shown in orange, and hydrogen bonds formed between the VH chain (i.e. N52–A54) and the H4 peptide (i.e. S1) are shown as dotted lines.
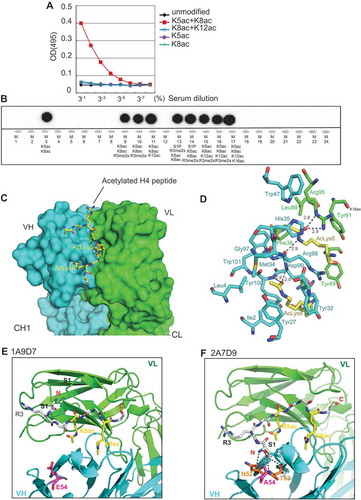
Figure 2. Genome-wide characterization of H4K5acK8ac sites and BRD2 binding sites. (A) A chart of genomic localization of H4K5acK8ac peaks. (B) Venn diagram showing a high overlap of H4K5acK8ac with two enhancer marks H3K27ac and H3K4me1. Using a simple intersection with at least 1 bp overlap, 78% of H4K5acK8ac sites overlap with 87% of H3K27ac sites and 80% of H4K5acK8ac with 50% of H3K4me1. (C) An example of a genome browser view of ChIP-seq signal of H4K5acK8ac, BRD2, other histone modification marks and gene expression signals by CAGE. (D) Heatmap of normalized H4K5acK8ac ChIP-seq intensities (read per million, RPM) within ±5 kb from the summit of active enhancers defined by H3K27ac located outside promoter (top) and active promoter defined by H3K4me3 at the TSS (bottom). H3K4me1 and H3K27ac mark active enhancer (top), while active promoters are highly enriched for H3K4me3 and H3K27ac but devoid of H3K4me1 (bottom). Color density indicates the enrichments of histone modification marks. (E) Enrichment of H4K5acK8ac and other histone modification marks within FANTOM5-defined enhancer regions. Average profiles (average RPM) of histone modification marks were plotted within ±5kb from the center of the enhancers (plotted by ngs.plot package 41). (F) Enrichment of active histone modifications within BRD2 binding sites, as shown by average ChIP-seq profiles of the histone modification marks. (G) Venn diagram showing a high overlap of BRD2–H4K5acK8ac (97.8%, left) and BRD2–H3K27ac (95.5%, right). (H) Enrichment of BRD2 and BRD4 ChIP-seq intensities (average RPM) in the super-enhancer regions identified by H4K5acK8ac ChIP-seq. BRD4 ChIP-seq from SCLC H2171 cell line was obtained from GSE4235513.
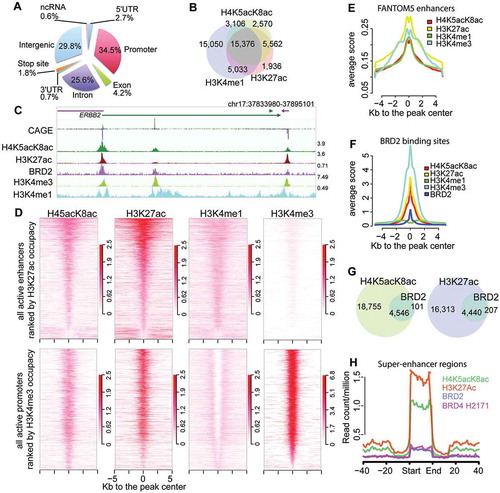
Figure 3. Association of BRD2 with histone H3 and H4 acetylation and different chromatin states defined by ChromHMM. (A) Bar plot showing the genome-wide association of BRD2-binding sites and histone modification marks (H3K4me1, H3K4me3, H3K27ac, and H4K5acK8ac) measured by odds ratio. The higher odds ratio means higher association. (B) Association between BRD2 binding and H4K5acK8ac (left), or H3K27ac (right), shown by a density plot. X-axis: the normalized ChIP-seq signal (log10 RPM + 0.25) of BRD2, y-axis: H4K5acK8ac (left) or H3K27ac (right). The regions were divided into weak and strong signal categories (thresholds: −1 for BRD2; 0 for H4K5acK8ac and H3K27ac) and the numbers represent contingency table between weak and strong categories of the compared marks. The odds ratios were calculated by Fisher Exact Test using the contingency table as input and represent the co-occurrence/enrichment between strong BRD2 signals and H4K5acK8ac (left) or H3K27ac signals (right). (C) Twenty ChromHMM chromatin states defined based on the histone modification marks and BRD2. The left panel represents the predicted chromatin states of indicated histone modifications, shown by different colors (orange for promoter/TSS, yellow for enhancer, green for transcription/elongation, and cyan for heterochromatin); the middle panel (genomic localization) indicates the genomic distribution of each state; the right panel shows the enrichment of each state within ±2 kb of TSS (RefSeq). (D) Genome browser views showing examples of H4K5acK8ac-preferential enhancer (upper) and H3K27ac-preferential enhancers (lower).
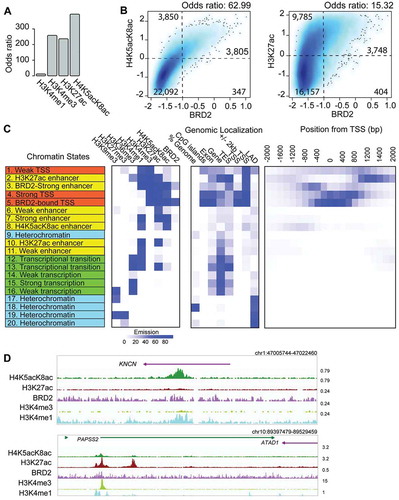
Figure 4. Effects of BET inhibition by JQ1 on BRD2 and H4K5acK8ac sites. (A) Treatment with 500 nM JQ1 for 24 hours led to global reduction of BRD2 binding sites (left) but not H4K5acK8ac at promoter (middle) or enhancer (right) regions. Average normalized read intensities of BRD2 and H4K5acK8ac ChIP-seq from JQ1 (red) or DMSO (blue)-treated cells were plotted on the BRD2 or H4K5acK8ac peaks derived from untreated cells, respectively. (B) Enrichment of H4K5acK8ac and BRD2 signal in the super-enhancer upon JQ1 treatment. (C) Genome browser view of BRD2 binding (top) and H4K5acK8ac signal (bottom) around the MYC-PVT1 loci in the JQ1- and DMSO treated cells. (D) MA scatter plot showing the log2 fold changes (log2FC >1 or >-1, FDR <0.05) of 535 increased and 1,256 reduced H4K5acK8ac peaks upon JQ1 treatment (y-axis) vs mean intensity (x-axis). (E) Relationship between changes in the H4K5acK8ac ChIP-seq peak signal (log2FC, x-axis) and the expression changes of their associated genes (log2FC, y-axis) upon JQ1 treatment. (F) Enrichment of H3K4me3, H3K27ac, H3K4me1 and BRD2 within ±5 kb from the summit of peaks with increased H4K5acK8ac signal (n = 553) upon JQ1 treatment, shown by normalized average profile. Example of the affected regions is shown on the right. (G) Enrichment of promoter and enhancer marks within ±5 kb from the summit of peaks with H4K5acK8ac decreased signal (n = 1,256). Example of the affected regions is shown on the right.
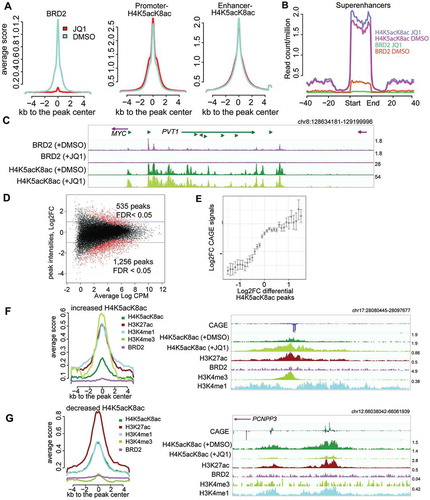
Figure 5. Effects of BET inhibition by JQ1 in the transcriptional regulation in H23 cells. (A) Density plot of H4K5acK8ac/H3K27ac ratio (x-axis) versus the transcriptional response (log2 fold change) to JQ1 treatment (24 hours) measured by CAGE (y-axis). The values were calculated within 1 kb window of 30,243 active centers. Noteworthy, a fraction of H4K5acK8ac-enriched sites is downregulated after JQ1 treatment, but virtually no H4K5acK8ac-enriched sites are upregulated. (B) Effects of different concentrations of JQ1 (5 nM, 50 nM, 500 nM, 1 μM, and 5 μM) on the cell apoptosis (left) and proliferation (right) during 24 hours (x-axis). The y-axis reflects the fold change of the number of the apoptotic (left) or proliferating (right) cells at the indicated hours (1–24 hours) compared to 0 hour. (C) MYC expression upon JQ1 treatment at different time points. The gene expression level was determined by quantitative PCR from the JQ1- and DMSO-treated cells and normalized against GAPDH. (D) FOSL1 expression upon JQ1 treatment at 24–72 hours. Left: FOSL1 expression upon 500 nM JQ1 (left) and DMSO (right) treatment, as examined by Western blot. Right: FOSL1 gene expression level upon JQ1 treatment at 3, 6, 12, and 24 hours, as validated by qPCR. The expression level was normalized against DMSO and GAPDH. (E) Heatmap of the pathways after JQ1 treatment and association of BRD2 with the upregulated pathways. The clustering was performed based on the normalized enrichment score (NES) of the enriched pathways (P value ≤0.01, FDR <0.25) and visualized as a color-coded matrix. Color density indicates the enrichment; the left panel shows association of BRD2 binding sites with each pathway.
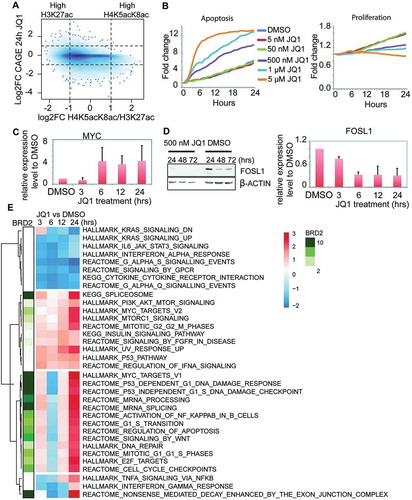
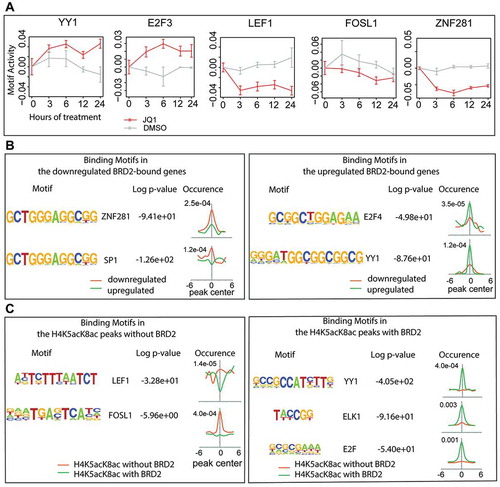
Figure 6. Association of BRD2 with different transcription factors. (A) The changes of motif activity of YY1, E2F3, LEF1, FOSL1, and ZNF281 transcription factors estimated by Motif Activity Response Analysis (MARA). Red and gray lines indicate the motif activities in the JQ1- and DMSO-treated cells, respectively. The motif activities reflect the expression of genes regulated by the transcription factors. (B) Transcription factor-binding motifs within the BRD2 peaks that overlap the downregulated (left) or the upregulated genes (right). The motifs were found de novo by HOMER and then linked to the best matching known motifs. The occurrence panels represent the enrichment of the motif within ±6 kb from the peak summit in BRD2 peaks at the downregulated (orange) and upregulated (green) genes. (C) LEF1 and FOSL1-binding motifs enriched in the H4K5acK8ac peaks without BRD2 (left) and YY1, ELK1, and E2F-binding motifs enriched in the H4K5acK8ac peaks with BRD2 (right).