Figures & data
Figure 1. Research design. Differentially methylated probes between the transcriptomically pre-defined PN and MES subtypes in GSCs and TCGA GBM bulk tumors were examined. CpG loci that are exclusively methylated or unmethylated in specific subtypes of GSCs and GBM (P <0.05) were compared to the corresponding gene expression profiles (P <0.05) to identify DNA methylation signatures. Then, the genes that were uniquely occurring either in GSCs or in GBM bulk tumors, or were commonly occurring in both were analyzed.
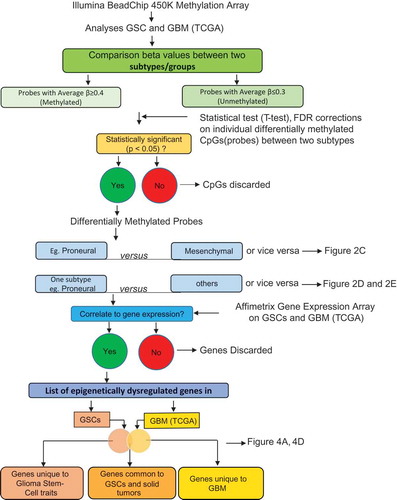
Figure 2. Subtype-associated methylation landscape in GSCs and GBM bulk tumors. (A) Methylation patterns based on 11,994 differentially methylated CpGs (P <0.05, FDR corrected) between transcriptomically pre-defined phenotypes of GSCs (4 PN and 6 MES) [Citation7,Citation14]. (B) Clustering of 23 GSCs generated PN, MES, and an unknown cluster U1 containing JK42, JK44, JK46, and JK83. (C) Differentially methylated genes between PN and MES in GSCs and GBM. (D) and (E) Hypermethylated or hypomethylated genes in each subtype of GSCs (D) and GBM (E). Numbers at the top of the bars in (C, D, E) indicate the number of genes that are methylated or unmethylated in the corresponding subtypes.
![Figure 2. Subtype-associated methylation landscape in GSCs and GBM bulk tumors. (A) Methylation patterns based on 11,994 differentially methylated CpGs (P <0.05, FDR corrected) between transcriptomically pre-defined phenotypes of GSCs (4 PN and 6 MES) [Citation7,Citation14]. (B) Clustering of 23 GSCs generated PN, MES, and an unknown cluster U1 containing JK42, JK44, JK46, and JK83. (C) Differentially methylated genes between PN and MES in GSCs and GBM. (D) and (E) Hypermethylated or hypomethylated genes in each subtype of GSCs (D) and GBM (E). Numbers at the top of the bars in (C, D, E) indicate the number of genes that are methylated or unmethylated in the corresponding subtypes.](/cms/asset/57ad7b4c-cee0-4c59-8f37-521231c2f2c3/kepi_a_1469892_f0002_oc.jpg)
Figure 3. Distribution of subtype-specific hypermethylated and hypomethylated probes with respect to gene location. (A) and (B) Hypermethylated CpGs (text in red) in PN, MES, and U1 GSCs (A), and PN, MES, CL, and N GBM (B). (C) and (D) Hypomethylated probes (text in green) in PN, MES, and U1 GSCs (C), and PN, MES, CL, and N GBM (D). (E) and (F) Distribution/comparison of differentially methylated CpG loci in their genomic location in PN versus MES GSCs (E) and GBM bulk tumors (F).
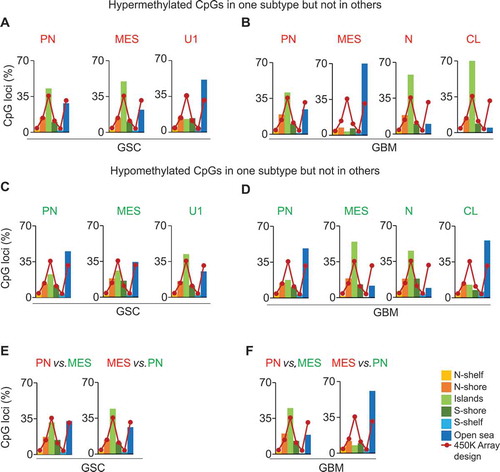
Figure 4. Subtype-associated DNA methylation signatures in GSC and GBM bulk tumors. (A) Differentially methylated and expressed genes between PN and MES that are either unique to either GSCs or GBM, or are common between them. Representative examples of genes that are methylated and silenced either in PN (B) or MES (C) commonly in GSCs and GBM bulk tumors. * P <0.05; ** P <0.01; *** P <0.001. (D) Hyper- or hypo-methylated genes associated with one specific GBM subtype but not in other subtypes. Numbers at the top of the bars indicate the absolute numbers of hyper- or hypo-methylated genes. First, average β-value of individual CpG locus (probe) was determined to generate differentially methylated probes and then the genes corresponding to differentially methylated probes were identified.
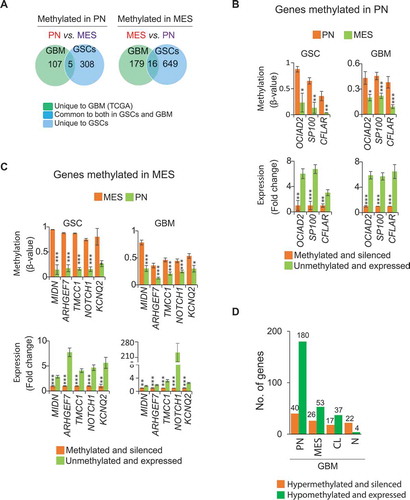
Figure 5. Global methylation profile of representative genes in GBM bulk tumors and GSCs. (A) Global methylation profiling of TMCC1 (a MES methylated gene) and (B) SP100 (a PN methylated gene). (C) Average β-value of all CpG loci in respective subtypes for TMCC1 (29 CpG loci) and (D) SP100 (10 CpG loci) from the 450K array, showing their methylation status in specific regions in respective subtypes. Methylation of these respective CpG loci also contributes to the correlation of methylation with the expression of these genes (Refer to ). *P <0.05; ** P <0.01; *** P <0.001.
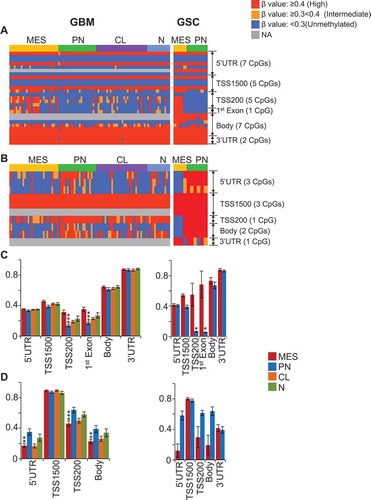
Figure 6. Methylation and expression of TMCC1 in GSCs and GBM bulk tumors. (A) TMCC1 is methylated in MES but unmethylated in PN in both GSCs and GBM. COBRA (B) and bisulphite sequencing (C) validated methylation of TMCC1 in PN and MES GSCs. Arrows represent the methylated CpG sites that were used as references to design primers. Colors indicate different probes identified. (D) qRT-PCR analysis. TMCC1 is silenced in MES GSCs and is expressed in PN GSCs. (E) Treatment of MES GSCs with 1 µM 5-Aza-dC restored the expression of TMCC1. Data are representative from three independent experiments. * P <0.05; **P <0.01: U: untreated control: T: treated with 5-Aza-dC.
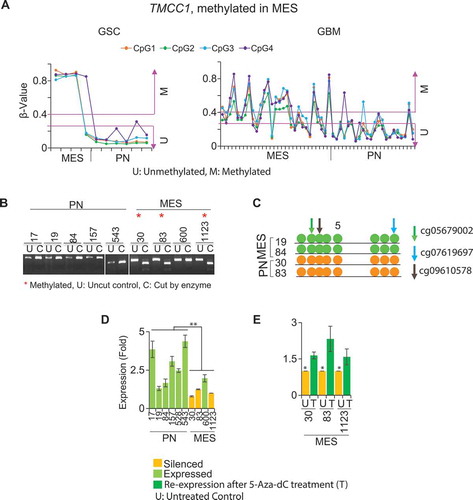
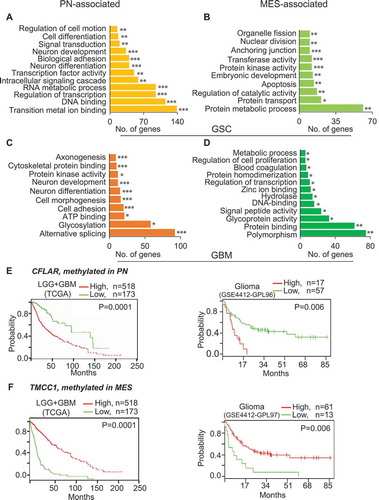
Figure 7. DNA methylation signature genes are associated with pathways and molecular functions and are predictive of clinical outcomes. Genes that are methylated in MES (A) and PN (B) in GSCs, as well as in MES (C) and PN (D) in GBM are associated with various molecular functions and pathways. (E) Low-expression of CFLAR, a PN-methylated/silenced but MES-unmethylated/expressed gene, and (F) high-expression of TMCC1, a MES-methylated/silenced PN-unmethylated/expressed gene exhibit better clinical outcome of glioma patients. * P <0.05; ** P <0.01; *** P <0.001.