
Figures & data
Figure 1. DNA methylation-independent functions of DNMT1. (A) Venn diagram indicating differentially expressed genes (DEG, purple circle) and differentially methylated genes (DMG, red circle) as well as their overlap (magenta) between E16 FACS-enriched Hmx3-Cre/tdTomato/Dnmt1 wild-type (Dnmt1 WT) and Hmx3-Cre/tdTomato/Dnmt1 loxP2 (Dnmt1 KO) POA cells determined by correlative RNA and MeDIP sequencing. (B) Gene ontology (GO) analysis of genes that were significantly up-regulated in FAC-sorted E16 Dnmt1-deleted Hmx3-Cre/tdTomato POA cells (P < 0.05; Benjamini adjusted, foldchange > 1.3) and which did not display changes in gene methylation compared with E16 Hmx3-Cre/tdTomato/Dnmt1 wild-type POA cells. (C-G) Representative microphotographs of dissociated E16 (+ 2 DIV) POA cells (C, D) and neuroblastoma (N2a) cells (E, F) treated either to control (C, E) or Dnmt1 siRNA (D, F), and stained for H3K4me3, shown as fluorescence intensity in black/white code and as thermal color-code (thermal LUT). The mean grey value is quantified relative to controls in G (n = 26 POA and 345 N2a cells for ctrl siRNA, n = 24 POA and 245 N2a cells for Dnmt1 siRNA). (H) Schematic illustration of the Pak6 gene locus with promoter (red), promoter flanking (light red), enhancer (yellow) and non-regulatory (white) sites according to UCSC genome browser showing DNA primer positions (#1, #2, #3) in regulatory (#1, #2) and non-regulatory (#3) gene regions. (I, J) ChIP-analysis of control and Dnmt1 siRNA-treated N2a cells with a specific H3K4me3 antibody reveals the association of H3K4me3 to specific primer locations (#1–3 in H) in the Pak6 gene (I), analyzed by quantitative PCR and normalized to the amount of input DNA (J; three individual experiments with four technical replicates each). IgG controls were included to determine non-specifically bound DNA. ‘n’ refers to the number of analyzed cells. **P < 0.01; ***P < 0.001; Student’s t-test. Scale bars: 10 μm in (C-F). Ctrl, control; siR, siRNA; POA, preoptic area.
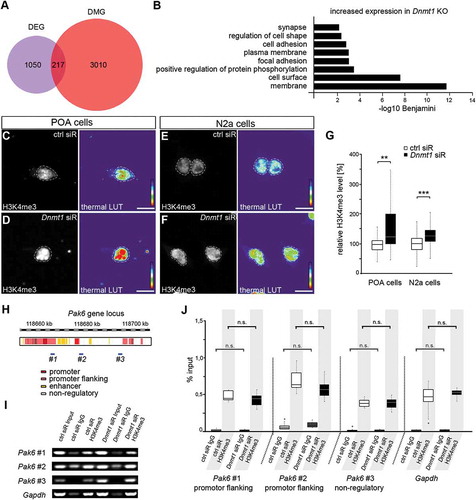
Figure 2. Repressive H3K27 trimethylation is reduced in Dnmt1-deficient cells. (A-E) Representative microphotographs of dissociated E16 (+ 2 DIV) POA cells (A, B) and N2a cells (C, D) treated either with control (A, C) or Dnmt1 siRNA (B, D) and stained for H3K7me3, presented as fluorescence intensity in black/white code and as thermal color-code (thermal LUT). The mean grey value relative to control is quantified in E (n = 34 POA and 118 N2a cells for ctrl siRNA, n = 32 POA and 144 N2a cells for Dnmt1 siRNA). (F, G) Protein levels of DNMT1, EZH2 and H3K27me3 in control and Dnmt1 siRNA-treated N2a cells analyzed with Western blot (G), normalized to ACTB and quantified in relation to control (G; five individual experiments). (H) Co-immunoprecipitation with a DNMT1-specific antibody revealed a protein-protein interaction with EZH2 in E16 POA and N2a cell samples analyzed by Western blot (three individual experiments, two animals per experiment for POA cells). ‘n’ refers to the number of analyzed cells. *P < 0.05;**P < 0.01;***P < 0.001; Student’s t-test. Scale bars: 10 μm in (A-D). Ctrl, control; siR, siRNA; POA, preoptic area.
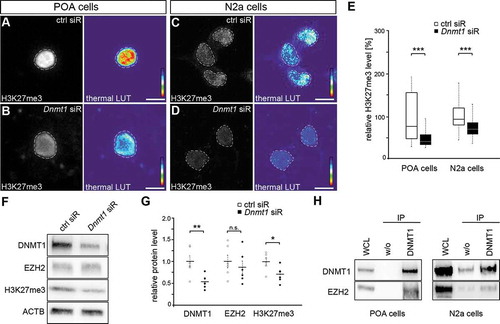
Figure 3. Dnmt1-depletion causes a reduced association of trimethylated H3K27 with Pak6 regulatory regions. (A) Schematic illustration of the Pak6 gene locus with promoter (red), promoter flanking (light red), enhancer (yellow) and non-regulatory (white) sites according to UCSC genome browser showing specific DNA primer positions (#1, #2, #3) in regulatory (#1, #2) and non-regulatory (#3) gene regions. (B, C) ChIP-analysis of control and Dnmt1 siRNA-treated N2a cells with a H3K27me3-specific antibody shows the association of H3K27me3 to the indicated primer locations (#1–3 in A) in the Pak6 gene (B), analyzed by quantitative PCR and normalized to the amount of input (C; three individual experiments with four technical replicates each). IgG controls indicate the amount of non-specifically bound DNA. ***P < 0.001; Student’s t-test. Ctrl, control; siR, siRNA.
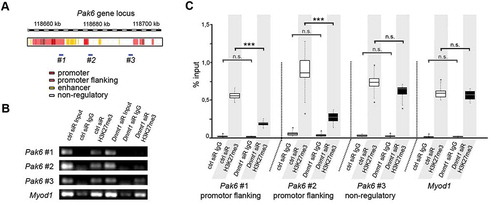
Figure 4. EZH2 inhibition by DZNep reduces global H3K27me3 levels and elevates Pak6 gene expression. (A-E) Representative microphotographs of dissociated E16 (+ 2 DIV) POA cells (A, B) and N2a cells (C, D) treated either with DMSO (A, C) or the EZH2 inhibitor DZNep (B, D) and stained with a H3K7me3-specific antibody, shown as fluorescence intensity in black/white code and as thermal color-code (thermal LUT). The mean grey value is quantified relative to DMSO controls in E (n = 37 POA and 120 N2a cells for DMSO, n = 36 POA and 102 N2a cells for DZNep). (F) Quantitative PCR displays increased Pak6 expression in DZNep-treated N2a cells compared to DMSO controls, normalized against Rps29 and Actb (three individual experiments with four technical replicates each). ‘n’ refers to the number of analyzed cells. ***P < 0.001; Student’s t-test.
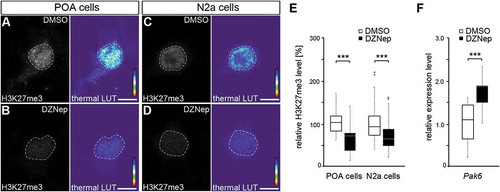
Figure 5. Enhanced Pak6 expression induced by EZH2 inhibition results in increased morphological complexity. (A-E) Representative microphotographs of dissociated E16 (+ 2 DIV) POA cells (A, B) and N2a cells (C, D) treated either with DMSO (A, C) or DZNep (B, D) and stained against TUBB3 (green channel) with a specific antibody, ACTB (red channel) with fluorescently labeled phalloidin and DAPI (blue channel). Quantification of cell morphology is shown in (E) as complexity index relative to DMSO controls. The complexity index is a product of primary neurite number, the branch point number of the longest process and the ratio between longest process length and the mean length of all other neurites. (E; n = 52 POA and 85 N2a cells for DMSO, n = 69 POA and 93 N2a cells for DZNep). (F-J) Representative microphotographs of dissociated E16 (+ 2 div) POA cells treated either with DMSO (F, H) or DZNep (G, I) in addition to control (F, G) or Pak6 siRNA (H, I), then stained against TUBB3 (green channel) with a specific antibody, ACTB (red channel) with fluorescently labeled phalloidin and DAPI (blue channel). The complexity index is quantified in (J) relative to DMSO + ctrl siRNA cell parameters (n = 39 POA cells for DMSO + ctrl siRNA, n = 43 POA cells for DZNep + ctrl siRNA, n = 51 POA cells for DMSO + Pak6 siRNA, n = 68 POA cells for DZNep + Pak6 siRNA). ‘n’ refers to the number of analyzed cells. **P < 0.01;***P < 0.001; Student’s t-test. Ctrl, control; siR, siRNA; POA, preoptic area.
