Figures & data
Table 1. Distributions of selected characteristics of the study participants by study phases. Data were expressed as Mean ± SD or Median (range) except where indicated.
Table 2. The effects of a 1-SD increment in placental expression of miRNA on gestational age and birthweight in Phase 2 study (n = 364). The indirect, direct, and total effects of miRNA expressions on birthweight were estimated using causal mediation analysis considering gestational age a mediator.
Figure 1. Directed acyclic graph (DAG) showing conceptual models for causal mediation analysis. We hypothesized that placenta-derived miRNAs will affect birthweight directly or indirectly via changing gestational age.

Figure 2. Controlled Direct Effects (CDEs) of selected placenta-derived miRNAs in relation to birthweight at gestational age ranging from 29 to 41 weeks. Panel A1, A2, and A3 illustrate the changes in mean birthweight [g] for a 1-SD increment in placental expression miR-1290 when cord blood arsenic exposure is at 25th, 50th, and 75th percentiles, respectively. Panel B, C, and D illustrate the changes in mean birthweight [g] for a 1-SD increment in placental expression of miR-195, miR-328, and miR-489, respectively. Solid black lines surrounded by shaded area represent the effect estimates and 95% confidence intervals. The horizontal blue dashed lines show the reference values and the vertical blue dashed lines represent the gestational age of 37 weeks. Models were adjusted for natural log cord blood arsenic exposure, maternal age, education, enrollment BMI, number of past pregnancies, infant sex, study site and surrogate variables.
![Figure 2. Controlled Direct Effects (CDEs) of selected placenta-derived miRNAs in relation to birthweight at gestational age ranging from 29 to 41 weeks. Panel A1, A2, and A3 illustrate the changes in mean birthweight [g] for a 1-SD increment in placental expression miR-1290 when cord blood arsenic exposure is at 25th, 50th, and 75th percentiles, respectively. Panel B, C, and D illustrate the changes in mean birthweight [g] for a 1-SD increment in placental expression of miR-195, miR-328, and miR-489, respectively. Solid black lines surrounded by shaded area represent the effect estimates and 95% confidence intervals. The horizontal blue dashed lines show the reference values and the vertical blue dashed lines represent the gestational age of 37 weeks. Models were adjusted for natural log cord blood arsenic exposure, maternal age, education, enrollment BMI, number of past pregnancies, infant sex, study site and surrogate variables.](/cms/asset/b21571f1-e834-4b0e-9b71-27205df06030/kepi_a_1481704_f0002_c.jpg)
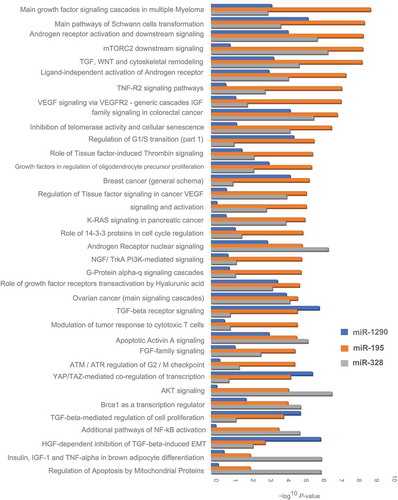
Figure 3. Gene enrichment pathways for selected miRNAs with in silico predicted targets. The vertical axis represents a description of the pathways, and the horizontal axis represents the – Log10(P value) of the significant enrichment pathways.

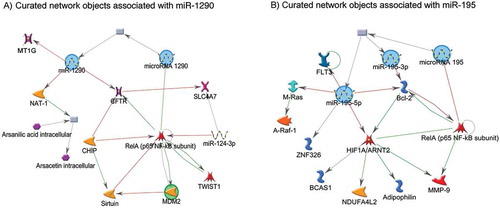
Figure 4. Networks of miR-1290 and miR-195 with experimentally validated target genes. The green lines connecting the nodes represent activation, whereas the red lines connecting the nodes represent inhibition. The arrow indicates the direction of the association.

Table 3. Effect estimates of gestational age and selected miRNAs in relation to birthweight.
Table 4. Study design and analysis work flow.
