Figures & data
Figure 1. Expression of Linc-smad7 in muscle cells and other mouse tissues. A. Linc-smad7 is a novel splicing variant of lncRNA-smad7. Boxes indicate exons; arrows indicate the direction of transcription. B. Coding potential of Linc-smad7 predicted by Coding Potential Calculator. C. Expression level of lncRNA-smad7-v1 during C2C12 myoblast proliferation and differentiation. D. Expression level of lncRNA-smad7-v2 during myoblast proliferation and differentiation. E. Expression level of Linc-smad7 during myoblast proliferation and differentiation. F. Expression level of total lncRNA-smad7 transcripts during myoblast proliferation and differentiation. G. Expression level of Linc-smad7 in mouse hind limb muscle. X-axis indicates mouse age. H. Expression level of Linc-smad7 in heart, liver, spleen, lung, kidney, brain, fat, and skeletal muscle tissues. Data are presented as mean ± SEM. n = 3.
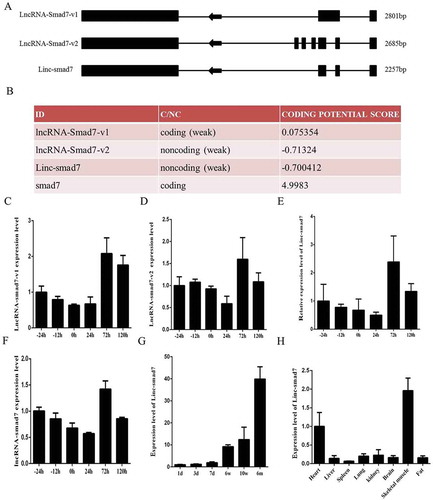
Figure 2. Effect of Linc-smad7 on myoblast growth. A. Expression level of Linc-smad7 24 h after transfection of C2C12 with siLinc-smad7. NC: control cells. siRNA: si-Linc-smad7-treated cells. B. Flow cytometry analysis after transfection with siLinc-smad7 (n = 2). C. Histogram bar graph summarizing the flow cytometry analysis showing the number of cells in each cell cycle phase. D. EdU proliferation assay showing the effect of siLinc-smad7 on myoblasts performed 24 h after transfection. The red fluorescent cells are in the S phase of mitosis; the blue fluorescent cells (nuclei stained with Hoechst 33,342) represent all the cells. E. Histogram bar graph showing the ratio of EdU-positive cells in NC and siLinc-sma7-trated cells. F. Expression level of Linc-smad7 in myoblasts transfected with the Linc-smad7 expression plasmid (pcDNA3.1) and NC. G. Flow cytometry analysis performed 24 h after transfection with Linc-smad7 expression plasmid. H. Histogram bar graph summarizing the flow cytometry analysis in (G). I. EdU proliferation assay performed 24 h after transfection with Linc-smad7 expression plasmid. J. Histogram bar graph showing the ratio of EdU-positive cells in NC and cells transfected with the Linc-smad7 myoblasts Results are presented as the mean ± SEM. n = 3. *P < 0.05; **P < 0.01.
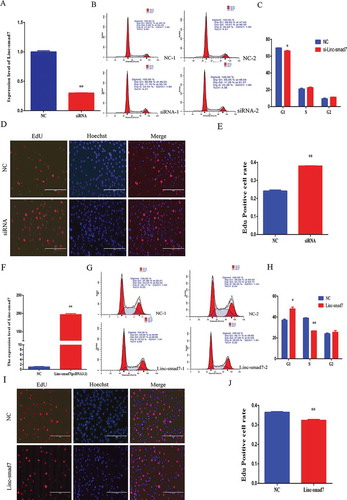
Figure 3. Effect of Linc-smad7 on myoblast differentiation. A. mRNA level of myogenic marker genes MyoD, MyoG, and MyHC 120 h after transfection of C2C12 cells with si-Linc-smad7. B. Western blot of C2C12 cells 120 h after transfection with si-Linc-smad7 using antibodies against MyoD, MyoG, and MyHC. C. Histogram bar graph after Western blot signal quantification indicating the protein level of myogenic markers after transfection with si-Linc-smad7. D. Immunofluorescence staining for myosin 120 h after transfection with si-Linc-smad7. E. Number of nuclei in myosin-positive myotubes 120 h after transfection with si-Linc-smad7. F-J. Idem as in (A-E) but after transfection with Linc-smad7 expression plasmid. Data are represented as mean ± SEM. *P < 0.05, **P < 0.01.
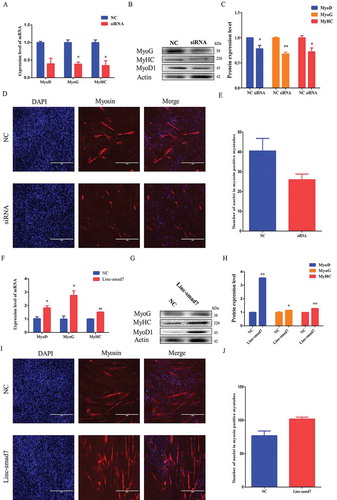
Figure 4. Linc-smad7 promotes skeletal muscle regeneration. A. HE-staining of tibialis anterior (TA) muscle 48 h after injection of CTX into the muscle. B. Level of Pax7 mRNA in TA 48 h after the injection of CTX. C. Linc-smad7 levels 7 days after transfection of the Linc-smad7 expression plasmid in vivo. D. Western blot detecting protein levels of myogenic-related genes 7 days after transfection of TA with the Linc-smad7 expression plasmid. E. Histogram bar graph of the signal quantification of the Western blot in (D) . F. HE-staining of CTX-injected muscle after transfection of the Linc-smad7 expression plasmid. G-J. Idem as in (C-F) but after transfection of siLinc-smad7. Data are represented as mean ± SEM. n = 3. *P < 0.05, **P < 0.01.
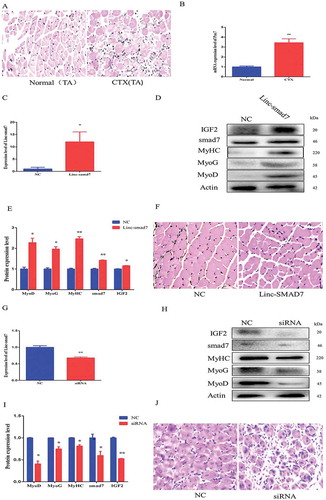
Figure 5. Effect of Linc-smad7 on the muscle regeneration transcriptome. A. Volcano plot representing the number of differentially expressed genes after transfection of TA muscles with the Linc-smad7 expression plasmid: 121 upregulated and 238 downregulated genes were identified. B. KEGG pathway scatterplot depicting the number of upregulated genes in pathway enrichment after transfection of the Linc-smad7 expression plasmid. Rich factor refers to the number of differentially expressed genes in the pathway C. KEGG pathway scatterplot showing the number of downregulated genes in pathway enrichment after transfection of the Linc-smad7 expression plasmid. D. GO enrichment analysis of genes that were upregulated 7 days after transfection of TA muscles with Linc-smad7 expression plasmid. The y-axis denotes the top ten enriched biological processes; the x-axis indicates the number of genes. E. GO enrichment analysis of genes that were downregulated after transfection of the Linc-smad7 expression plasmid. F. qRT-PCR of selected genes involved in muscle development and immune response . Data are represented as mean ± SEM. n = 3. *P < 0.05, **P < 0.01.
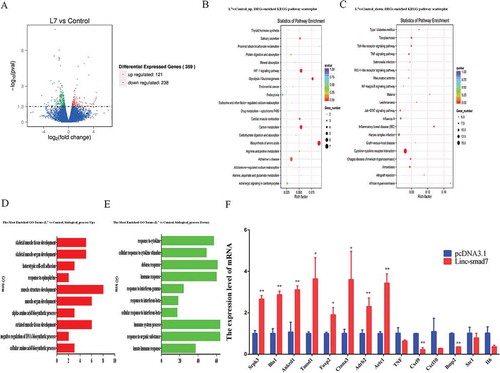
Figure 6. Linc-smad7 is a target of miR-125b during myogenesis. A. Expression level of Linc-smad7, LncRNA-smad7, Neat1, and actin in C2C12 myoblast cell nucleus and cytoplasm detected by agarose gel electrophoresis. B. Sequence information of relevant regions of miR-125b, Linc-smad7, and 3’UTR of smad7. The sequence in red represents the seed region of miR-125b and its target region. C. Complementary pairing between the sequences of miR-125b-5p and Linc-smad7. The right scheme shows the calculated ΔG value. D. Peak map of psi-check2 vector sequencing results of Linc-smad7 and smad7 3’UTR sequences. The red boxes represent the mutant bases. E. RIP assay was conducted using an antibody against Ago2. Linc-smad7 was detected by agarose gel electrophoresis. U1 snRNA was used as a control. F. qRT-PCR of C2C12 myoblasts transfected with biotin-miR-NC or biotin-miR-125b to detect Linc-smad7. G. Linc-smad7 wild or mutant type psi-check2 plasmid was transfected into HEK293T cells together with miR-125b mimic. Luciferase activities were measured 24 h after transfection. H. Smad7 wild or mutant type psi-check2 plasmids was transfected into HEK293T cells together with miR-125b mimic. Luciferase activities were measured 24 h after transfection. I,J. Cells transfected with Linc-smad7 expression vector. K,L. Cells transfected with siRNA. Detection of IGF2 and smad7 protein levels by Western blot. M,N. Detection of IGF2 and smad7 protein levels by Western blot after overexpression of miR-125b. Data are represented as mean ± SEM. *P < 0.05, **P < 0.01.
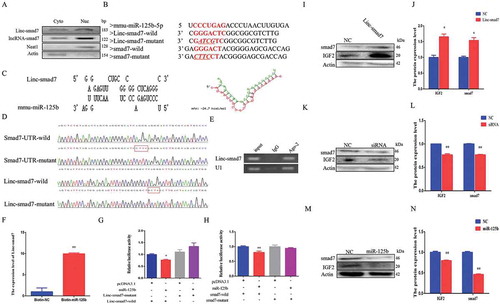
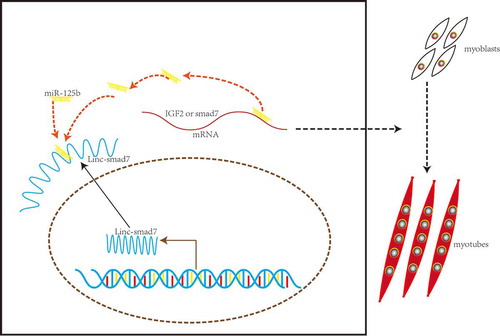
Figure 7. Model of Linc-smad7 regulatory mechanism on myogenesis. In this model, Linc-smad7 regulates myogenesis by functioning as a ceRNA that sequesters miR-125b, thereby relieving its repressive effect on IGF2 and smad7 to promote skeletal muscle development.