Figures & data
Figure 1. Histone acetylation at p300-associated loci in early myoblast differentiation.
(A) Union analysis of p300 peaks in proliferating C2C12 myoblasts (GM) and myoblasts differentiated for 24 hours (DM). (B) Correlation plot of p300 peak coverage in proliferating and differentiating myoblasts, where each dot represents the absolute length of a p300 peak shared between GM and DM conditions (n = 1190; R = Spearman’s correlation coefficient). (C) Western analysis of p300, myogenin, and the indicated histone marks with β-tubulin as a loading control. (D) Quantification of the blots in panel C is presented as fold change in relation to proliferating myoblasts (error bars: SD; n = 3; **, P <0.01). (E) Annotation of chromatin state association of the p300 peaks as categorized in Panel A. Shown are also the average read enrichment profiles of H4K8ac, H3K9ac, H3K18ac, and H3K27ac spanning 2 kb across the indicated p300 loci annotated above. (F) Boxplots present log2-fold change in signal enrichment at the p300 loci. The differential median between enrichment at p300 loci unique to differentiation or shared are displayed to the right (Wilcoxon signed-rank test, P <0.05).
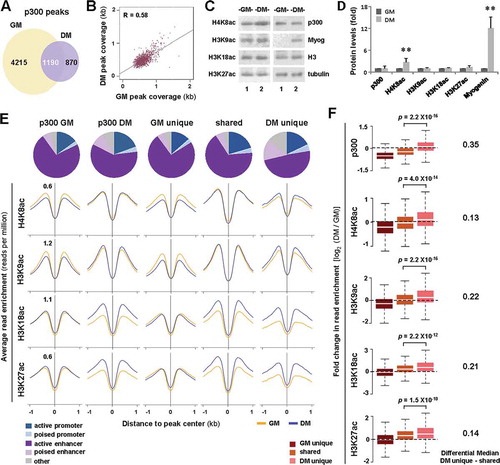
Figure 2. Functional annotation of p300-associated loci.
(A) GO enrichment analysis of p300-associated loci. Bar graph represents an inversion of binomial ranking for each term as output by GREAT. (B) RT-qPCR analysis of gene expression levels for p300-dependent differentiation responsive targets is presented as fold change relative to proliferating myoblasts, after normalization to internal control (error bars: SEM; n = 3; *, P <0.05). (C) De novo motif analysis of p300 loci, where top-ranked motifs are displayed with P values for the motifs being equal to or lower than the one stated in each category. Percentages of p300 loci bound by the predicted transcription factor motifs are presented as a bar graph to the right.
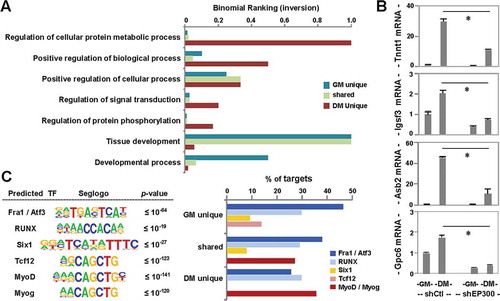
Figure 3. Characterization of MyoD sites in early differentiation.
(A) Venn diagram depicts unique or maintained MyoD peaks in C2C12 proliferating myoblasts (GM) and myoblasts differentiated for 24 hours (DM). (B) Correlation plot of MyoD peak coverage, in which each dot represents the absolute length of a MyoD peak, shared between GM and DM conditions (n = 6445; R = Spearman’s correlation coefficient). (C) Chromatin state distribution of MyoD peaks as categorized in Panel A. The average read signal profiles for H4K8ac, H3K9ac, H3K18ac, and K3K27ac spanning 2 kb across MyoD binding sites are displayed below. (D) Boxplots present the quantification of log2-fold change in histone acetylation between differentiation and proliferation corresponding to the MyoD sites as categorized in Panel C. The difference in the median values of differentiation unique or maintained is displayed to the right. (E) The expression levels of ENSEMBL genes associated to the MyoD peaks is presented as FPKM measured by RNA-seq analysis (Wilcoxon signed-rank test, P <0.05).
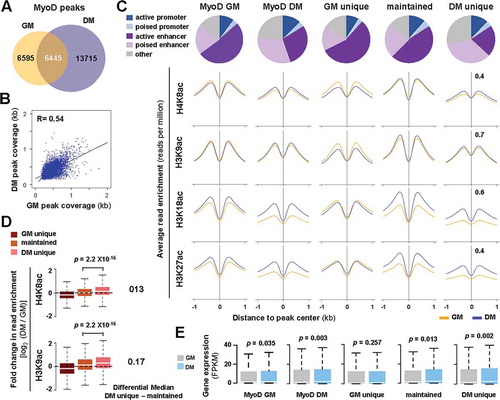
Figure 4. MyoD and p300 overlap in early myoblast differentiation.
(A) The magnitude of overlap between p300 and MyoD peaks in proliferating myoblasts (GM) and myoblasts differentiated for 24 hours (DM) is presented as a percentage of total p300 peaks in each condition. (B) Chromatin state distribution of p300 loci with or without a MyoD overlap. The average read density of histone acetylation spanning 2 kb across corresponding p300 loci is presented below. (C) The distance of p300 peaks with and without a MyoD overlap in relation to the closest TSS is presented as a bar graph. (D) Boxplots present log2-fold change in signal enrichment between differentiating and proliferating conditions at the indicated category of p300 loci. (E) GO analysis of p300 loci with or without a MyoD overlap is plotted as an inversion of binomial ranking as output by GREAT. (F) The expression levels of ENSEMBL genes associated to the indicated categories of p300 peaks are plotted as FPKM measured by RNA-seq analysis (Wilcoxon signed-rank test, P <0.05).
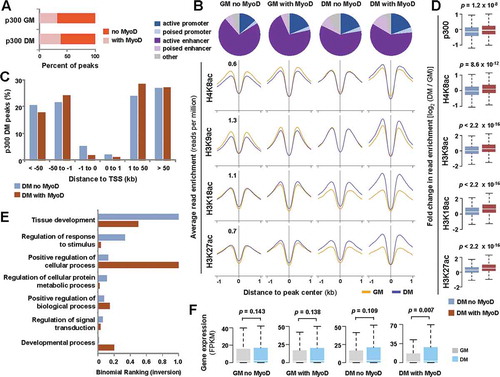
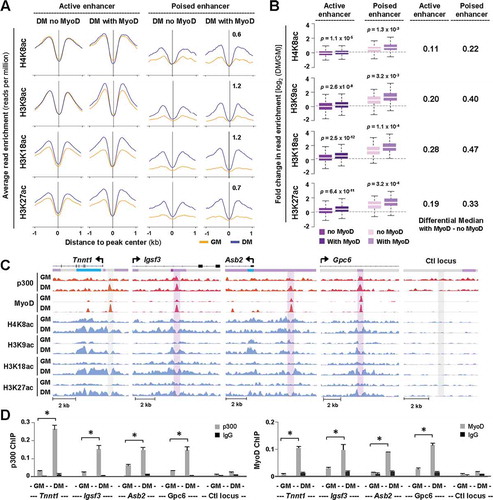
Figure 5. Overlap of p300 and MyoD at distinct chromatin state.
(A) Normalized average H4K8ac, H3K9ac, H3K18ac, and H3K27ac read density in proliferating myoblasts (GM) and myoblasts differentiated for 24 hours (DM) was plotted 2 kb across p300 loci with or without a MyoD overlap at active or poised enhancers. (B) Quantification of log2-fold difference in histone acetylation between differentiation and proliferation as categorized in Panel A. The differential median for signal enrichment is displayed to the right. (C) Genome browser view of p300, MyoD and histone acetylation read density at Tnnt1, Igsf3, Asb2, and Gpc6 loci. Black bars show Refseq gene position and the colors of ChromHMM track below correspond to that designated to each chromatin state as illustrated in ). (D) ChIP-qPCR analysis was performed for identified target loci, using antibodies against p300 and MyoD. Normal IgG antiserum and a random locus (Ctl) were used as negative controls. Quantification is presented as the percentage of enrichment in relation to input chromatin DNA (error bars: SEM; n = 3; *, P <0.05).