Figures & data
Table 1. Characteristics of the study population CHAMACOS.
Table 2. Pearson Correlation coefficients for all EPIC and 450K comparisons for the population CHAMACOS.
Figure 1. β values for all overlapping probes on 450K vs. beta values on EPIC for a newborn sample.
Figure 2. Distribution of correlation coefficients for individual CpG sites, separated by probe type. Type II probes have a greater density of CpG sites with higher correlation coefficients.
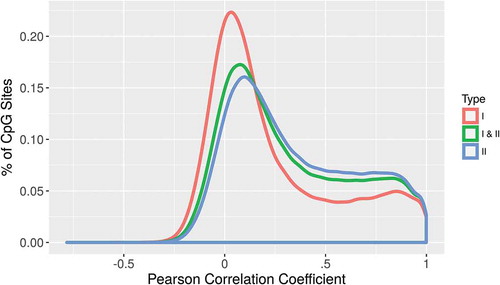
Figure 3. The correlation of β values between 450K and EPIC relative to the variance of methylation at each site (top). Sites in the lowest quartile of correlation had low variance and were mostly completely methylated or completely unmethylated (bottom left). Sites in the highest quartile of correlation had high variance of methylation (bottom right).
Figure 4. The absolute difference in β value at each CpG site between 450K and EPIC for newborns is plotted on the y-axis. Sites which also showed large differences >0.25 in the 14-year data set are highlighted in green and counts of sites exceeding thresholds of 0.1, 0.25, and 0.5 are shown on the right side of the plot.
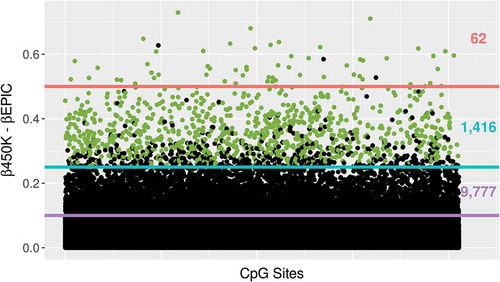
Figure 5. Regression β values for all overlapping probes on 450K vs. regression beta values on EPIC analyses of differentially methylation positions by sex in newborns.
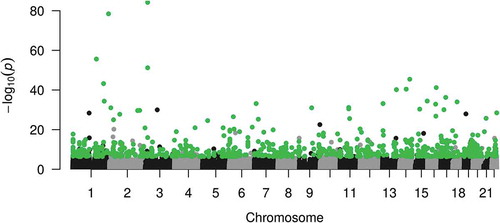
Figure 6. Manhattan plot showing differentially methylation positions by sex in newborns on 450K in autosomes. Sites highlighted in green are the 999 of the top 1,000 autosomal 450K hits, which were significant (FDR q <0.05) in EPIC analyses.