
Figures & data
Table 1. (A) Other gene expression differences in the hippocampus of females across treatment groups. Data shown as mean, with lower and upper 95% confidence intervals shown in parenthesis. (B) Other gene expression differences in the hippocampus of males across treatment groups. Data shown as mean, with lower and upper 95% confidence intervals shown in parenthesis.
Figure 1. Gene expression differences in the hippocampus of female and male rats developmentally exposed to BPA or EE. (a) Avp expression in females. (b) Avp expression in males. (c) Otr expression in females. (d) Otr expression in males. P values are shown in the individual panels. Fold change refers to the gene expression level relative to that in the vehicle control group using the 2−ΔΔCt method. Statistical significance was determined using the ΔCt values. The graphs depict the mean ± upper and lower 95% confidence interval.
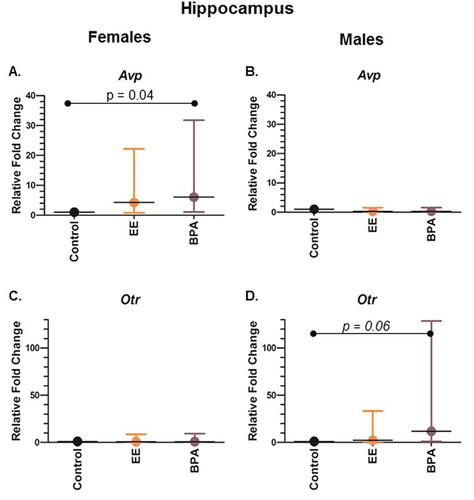
Figure 2. Effect of early-life exposure to EE and BPA on the methylation and expression of Bdnf in the adult rat hippocampus. (a) Schematic diagram showing the presence of a CG-rich region (green) at the promoter region of Bdnf, which is upstream of the transcription start site (TSS). Figure with annotation modified from UCSC Genome Browser. Region used for primer design (500 bp upstream and 100 bp downstream of the CG-rich region) is highlighted with a red line. (b) Primer design using MethPrimer. The blue highlighted region under the curve indicates the CG-rich region within the sequence used for primer design. A blue line indicates the target region for bisulfite sequencing. Methylation pattern of the putative 5ʹ promoter region of Bdnf in the hippocampus of (c) males and females, (d) females, and (e) males with early-life exposure to vehicle control (white), 0.5 μg EE/kg bw/day (EE; orange), and 2,500 μg BPA/kg bw/day (BPA; violet). Data expressed as mean ± SEM. Each circle represents the average % methylation of each corresponding CG site from 6–7 individual colonies (n = 5 males and n = 5 females per group). For methylation analysis, * P <0.05, *** P <0.001, and **** P <0.0001 vs. Vehicle by Two-way ANOVA and Tukey’s multiple test comparison. For gene expression analysis, *** P <0.001 vs. Vehicle by One-way ANOVA and Tukey test. Gene expression levels are expressed as gene expression level in treatment groups relative to the control group using the 2−ΔΔCt method.
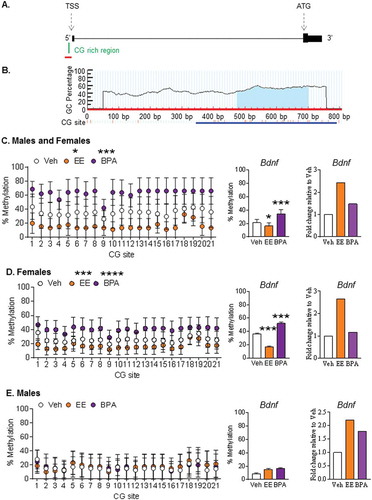
Table 2. Comparison of hippocampal gene expression differences between females and males within the same treatment group.
Figure 3. Correlation analyses for hippocampal Bdnf gene expression. (a) Overall correlation between the expression level of Bdnf and % promoter methylation of Bdnf in rats with all data points included. (b) Overall correlation between the expression level of Bdnf and the rate of sniffing the correct hole in Barnes maze [Citation26] in female rats. Gene expression levels are expressed in log 2 values and as Ct value of Rpl19 relative to that of the target gene. Percentage methylation of the putative 5ʹ end region of Bdnf is in log value. P <0.05 was considered as statistically significant. Only samples with a detectable Ct value were used in the correlation analysis.
![Figure 3. Correlation analyses for hippocampal Bdnf gene expression. (a) Overall correlation between the expression level of Bdnf and % promoter methylation of Bdnf in rats with all data points included. (b) Overall correlation between the expression level of Bdnf and the rate of sniffing the correct hole in Barnes maze [Citation26] in female rats. Gene expression levels are expressed in log 2 values and as Ct value of Rpl19 relative to that of the target gene. Percentage methylation of the putative 5ʹ end region of Bdnf is in log value. P <0.05 was considered as statistically significant. Only samples with a detectable Ct value were used in the correlation analysis.](/cms/asset/a950bc05-89a9-4bd4-9475-b1a89fa82d3b/kepi_a_1497388_f0003_oc.jpg)
Figure 4. Correlation between velocity in the Barnes maze and hippocampal expression levels of (a) Avp, (b) Esr2, (c) Oxt, and (d) Otr in control rats. Gene expression levels are expressed in log 2 values and as Ct value of Rpl19 relative to that of the target gene. Percentage methylation of the putative 5ʹ end region of Bdnf is in log value. Velocity is expressed as mean from seven observations and was previously reported in [Citation26]. P <0.05 was considered as statistically significant. Only samples with a detectable Ct value were used in the correlation analysis.
![Figure 4. Correlation between velocity in the Barnes maze and hippocampal expression levels of (a) Avp, (b) Esr2, (c) Oxt, and (d) Otr in control rats. Gene expression levels are expressed in log 2 values and as Ct value of Rpl19 relative to that of the target gene. Percentage methylation of the putative 5ʹ end region of Bdnf is in log value. Velocity is expressed as mean from seven observations and was previously reported in [Citation26]. P <0.05 was considered as statistically significant. Only samples with a detectable Ct value were used in the correlation analysis.](/cms/asset/96e317c1-090a-453d-af21-9ae01e2b45c1/kepi_a_1497388_f0004_oc.jpg)