Figures & data
Figure 1. Clustering tendency of CpG dinucleotide changes with evolutionary divergence. (a) O/E heat maps of all 16 dinucleotides in ten species representing an evolutionary progression towards higher vertebrates. The 1st and 2nd base of dinucleotides are shown at left and top respectively. The color denotes O/E values. (b) 2D Hilbert curves of CpG dinucleotide. CpG density is denoted by red color. Chromosome 1 is used here except E. coli for which whole genome is used. A blowout at the right to show the details of a part of the whole chromosome/genome. (c) Histograms of the distances (bp) between a CpG site and its following 25th CpG site along genome. The first peaks indicate the existence of clustered CpGs whose distances are short, while the major peaks represent the average distances between CpGs in the genome. (d) 2D Hilbert curves of ApT dinucleotides. (e) Histograms of the distances (bp) between an ApT site and its following 25th ApT site along genome. (f) Tracks of CpG density and ApT density in UCSC genome browser. CpG and ApT densities were calculated as the occurrences in 2500 bp sliding windows.
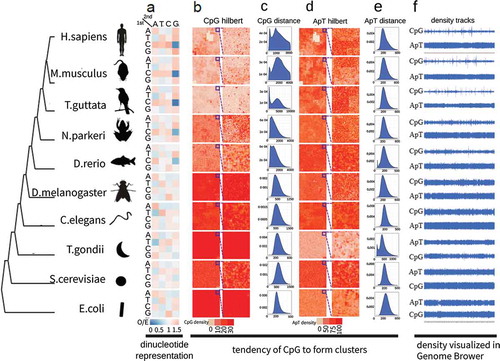
Figure 2. Negative correlation and complementary matching between CpG density and DNA methylation. (a) Density map of CpG density and DNA methylation. The scatter plot between CpG density and DNA methylation was converted to density map via two-dimension kernel density estimation to avoid overploting. Chromosome 18 in mouse cerebellum tissue was used here. CpG density was calculated as the occurrences of CpG sites in each 2500 bp sliding window. DNA methylation was calculated using the grand method in each 2500 bp sliding window. The histograms of DNA methylation and CpG density are at the top and right respectively. Cor denotes Pearson correlation coefficient. (b) The inverse correlation of DNA methylation for binned CpG density. Data were from chromosome 15 of each of the 18 human tissues. Shown at upper right corner is the mean ± SD of Pearson correlation coefficient of 18 tissues. (c) The inverse correlation of DNA methylation and CpG density along gene body. All mouse known genes (n = 32,595) were divided into 10 groups according to CpG density height of promoter regions, and each gene was further divided into 40 bins along gene body from transcription start site to transcription end site. In each bin of each group, the average CpG density and DNA methylation were calculated (d) Overall complementary matches in UCSC genome browser. DNA methylation (mouse bone marrow tissue) and CpG density were shown separately for Watson (above the baseline) and Crick (below the baseline) strands. (e) Complementary matches under one unified scale. Scales of DNA methylation and CpG density were unified to the range of 0 to 1 by modified Min-Max rescaling and plotted in one graph. (f) Histograms of Complementary index. Data were from chromosome 19 of aorta tissue and bone marrow tissue for human and mouse respectively. (g) Percentage of complementary (complementary index >70%) and uncomplimentary (complementary index <70%) sites in promoter, intergenic and gene body regions in human and mouse genome.
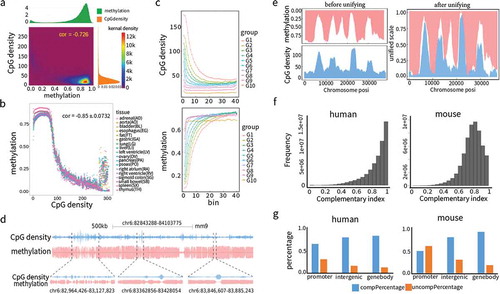
Figure 3. Nonlinear modelling and algorithm development based on complementarity between CpG density and DNA methylation. (a) Genome partition algorithm (see methods) by modelling the relationship between CpG density and DNA methylation with nonlinear function. Complementary coefficient and differential coefficient
were divided into three categories high (H,
> 70% quantile,
> 70% quantile), medium (M, 20% quantile<
< 70% quantile, 20% quantile<
< 70% quantile) and low (L,
< 20% quantile,
< 20% quantile) according to their distributions. Combining
and
, genome was partitioned into four types of regions: Conflict of Gap (COG) regions, Conflict of Overlap (COO) regions, Harmony with Medium Value (HMV) regions, and Harmony with Extreme Value (HEV) regions. (b) Partitioned regions snapshot from UCSC genome browser. Both single site and sliding window representations are presented. In single site view, CpG sites are marked out by blue bars, methylation is the fraction of methylated reads in total covered reads for each CpG site on Crick (above baseline) and Watson (below baseline) strands. In sliding window view, CpG and methylation refer to CpG density and average methylation in each window on both strands. The four region types, COG (green), COO (blue), HMV (cyan), and HEV (red) are labelled at the top. (c) The proportions in 18 human tissues of COO and COG that coincided with various genome feature regions (3’UTR, 5’UTR, promoter, exon, intron). Coefficient of variations were calculated as the ratio of standard deviation to mean in 18 tissues. (d) Positive correlations of the amount of HMV, COG and COO regions in the eight tissues shared by human and mouse. (e) Unsupervised hierarchical clustering analysis of human and mouse tissues based on DNA methylation level in COG and DMR regions. Tissues were colored to reflect the similarities of their normal functional or developmental origins. Human and mouse DMRs were from the studies[Citation6,Citation34].
![Figure 3. Nonlinear modelling and algorithm development based on complementarity between CpG density and DNA methylation. (a) Genome partition algorithm (see methods) by modelling the relationship between CpG density and DNA methylation with nonlinear function. Complementary coefficient pcand differential coefficient pd were divided into three categories high (H, pd> 70% quantile, pc> 70% quantile), medium (M, 20% quantile< pd < 70% quantile, 20% quantile< pc < 70% quantile) and low (L, pc< 20% quantile,pd < 20% quantile) according to their distributions. Combining pc andpd, genome was partitioned into four types of regions: Conflict of Gap (COG) regions, Conflict of Overlap (COO) regions, Harmony with Medium Value (HMV) regions, and Harmony with Extreme Value (HEV) regions. (b) Partitioned regions snapshot from UCSC genome browser. Both single site and sliding window representations are presented. In single site view, CpG sites are marked out by blue bars, methylation is the fraction of methylated reads in total covered reads for each CpG site on Crick (above baseline) and Watson (below baseline) strands. In sliding window view, CpG and methylation refer to CpG density and average methylation in each window on both strands. The four region types, COG (green), COO (blue), HMV (cyan), and HEV (red) are labelled at the top. (c) The proportions in 18 human tissues of COO and COG that coincided with various genome feature regions (3’UTR, 5’UTR, promoter, exon, intron). Coefficient of variations were calculated as the ratio of standard deviation to mean in 18 tissues. (d) Positive correlations of the amount of HMV, COG and COO regions in the eight tissues shared by human and mouse. (e) Unsupervised hierarchical clustering analysis of human and mouse tissues based on DNA methylation level in COG and DMR regions. Tissues were colored to reflect the similarities of their normal functional or developmental origins. Human and mouse DMRs were from the studies[Citation6,Citation34].](/cms/asset/59da055a-2dad-447a-a61f-f3e52eb14bea/kepi_a_1500057_f0003_oc.jpg)
Figure 4. Selective promoter usage determined by tpCOGs. (a) Heatmap of DNA methylation in COGs of human aorta. The heatmap was vertically ranked by standard deviation (SD) across 18 tissues and horizontally clustered by Euclidean distance. Shown on the top is methylation mean of each tissue, on the right is SD of variable (red, SD > 0.15) and stable (green, SD < 0.15) COGs, on the top right corner is the histogram of SD. (b) The amount of tpCOGs and tdCOGs in all human tissues. (c) Snapshot of the mouse TAOK3 gene in UCSC genome browser. H3K4me3 and PolII data were generated by ChIP-seq [Citation34]. Cap analysis gene expression (CAGE) data were obtained from the FANTOM research projects [Citation45]. TSS-I, TSS-II, and TSS-III denote the 1st, 2nd, and 3rd transcription start site. TSS-II and TSS-III (light blue colored) were identified as TCPs in bone marrow and spleen, or cerebellum and cortex, respectively. See S23 Fig for more thorough data. (d) Heat map of DNA methylation and the corresponding H3K4me3 in tpCOG-coincident promoters (TCPs) and tpCOG-incoincident promoters (TICPs). The heatmap was vertically ranked by CpG number in promoter regions (500 bp up- and down-stream of transcription start site). Maxdiff denotes the maximum difference of methylation among 18 human tissues. The smooth blue lines are the trend lines fitted by LOESS method. H3K4me3 signal refers to the number of ChIP-seq reads falling in promoter regions.
![Figure 4. Selective promoter usage determined by tpCOGs. (a) Heatmap of DNA methylation in COGs of human aorta. The heatmap was vertically ranked by standard deviation (SD) across 18 tissues and horizontally clustered by Euclidean distance. Shown on the top is methylation mean of each tissue, on the right is SD of variable (red, SD > 0.15) and stable (green, SD < 0.15) COGs, on the top right corner is the histogram of SD. (b) The amount of tpCOGs and tdCOGs in all human tissues. (c) Snapshot of the mouse TAOK3 gene in UCSC genome browser. H3K4me3 and PolII data were generated by ChIP-seq [Citation34]. Cap analysis gene expression (CAGE) data were obtained from the FANTOM research projects [Citation45]. TSS-I, TSS-II, and TSS-III denote the 1st, 2nd, and 3rd transcription start site. TSS-II and TSS-III (light blue colored) were identified as TCPs in bone marrow and spleen, or cerebellum and cortex, respectively. See S23 Fig for more thorough data. (d) Heat map of DNA methylation and the corresponding H3K4me3 in tpCOG-coincident promoters (TCPs) and tpCOG-incoincident promoters (TICPs). The heatmap was vertically ranked by CpG number in promoter regions (500 bp up- and down-stream of transcription start site). Maxdiff denotes the maximum difference of methylation among 18 human tissues. The smooth blue lines are the trend lines fitted by LOESS method. H3K4me3 signal refers to the number of ChIP-seq reads falling in promoter regions.](/cms/asset/051e7ffc-a277-4f0d-988c-632e6284a170/kepi_a_1500057_f0004_oc.jpg)
Figure 5. tdCOGs are potential gene regulatory elements. (a-b) The significant enrichment of transcription factor binding motif in tdCOGs. We obtained transcription factor motif (n = 243) from the HOMER database and (a) counted their overlapping with tdCOGs, promoters, enhancers, and random genomic regions in human adrenal tissue. (b) P values (t-test) between tdCOGs and random genomic regions were calculated in each of the 18 human tissues and shown in empirical cumulative distribution plot. (c-d) The significant enrichment of DNaseI hypersensitivity in tdCOGs. We downloaded DNaseI hypersensitivity sites from UCSC genome browser and (c) counted their overlapping with tdCOGs, promoters, enhancers, and random genomic regions in human adrenal tissue. (d) P values (t-test) between tdCOGs and random genomic regions were calculated in each of the 18 human tissues and shown in empirical cumulative distribution plot. (e-f) Higher sequence conservations in tdCOGs. We downloaded sequence conservation data from UCSC genome browser and (e) calculated the mean conservation scores in tdCOGs, promoters, enhancers, and random genomic regions in human adrenal tissue. (f) P values (t-test) between tdCOGs and random genomic regions were calculated in each of the 18 human tissues and shown in empirical cumulative distribution plot. The vertical dashed lines in (b, d, f) mark the x-axis value of P = 0.01. Random genomic regions were selected for multiple times with the same number of tdCOGs (n = 769). (g) Genome wide comparison of CpG density, DNA methylation, sequence conservation, transcription factor bind motif and DnaseI hypersensitivity sites between tdCOGs (G) and HMVs (H) for human adrenal tissue in circos plot. The outmost circle indicates the cytobands of 24 head-to-tail connected chromosomes. Bar height in each circle denotes signal intensity of the corresponding chromosome features. (h) Genome wide comparison of histone modification signals between tdCOGs and HVMs for human adrenal tissue in circos plot. (i-k) Enrichment of histone modifications in tdCOGs, promoters, and enhancers in human adrenal tissue. The regions, after expanding half of their length upstream and downstream, were divided into 100 equal bins. ChIP-seq reads falling in each bin were averaged. (l) Comparison of histone modifications between tdCOGs and enhancers in 18 human tissues. Using promoters as standard, we calculated the fold changes of H3K4me1, H3K4me3, and H3K27ac signals in tdCOGs and enhancers in all 18 human tissues and presented them after log2-transformation.
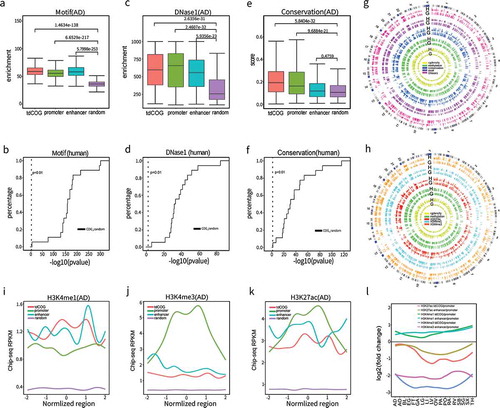
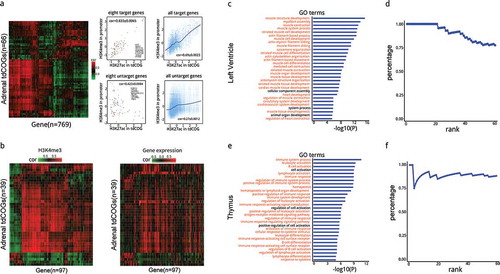
Figure 6. Prediction and analysis of tdCOG targeted genes. (a) Heatmap of the correlation coefficient between human adrenal-derived tdCOGs and their target genes. Correlation coefficients were calculated using H3K27ac signals in each tdCOG and H3K4me3 signals in each promoter across 18 human tissues. Genes with high correlation (> 0.6, shown in red in the heatmap) were considered as the targets of tdCOGs, and with low correlation (shown as green) were considered as non-targets. Signal intensities of histone modifications are shown in scatter plots for the 8 typical target and untargeted genes, or for all the target and untargeted genes. Cor denotes the mean ± SD of correlation coefficients of the eight genes or all the genes. Only tdCOGs on chromosome 1 are shown. (b) Comparison of histone-derived correlation and transcription-derived correlation. Heatmaps were generated as in (a). tdCOGs were also from human adrenal tissue and confined to chromosome 1. Only genes with detectable expression levels were considered, which led to less genes than (a). Histone modification heatmap (left) was clustered, and gene expression heatmap (right) is shown in the same order. (c and e) Functional annotation of target genes in left ventricle and thymus. Gene ontology (GO) terms associated with target genes were retrieved from DAVID database. The terms were ranked by P values (Fisher Exact test). Terms marked in red denote direct functional association with the corresponding tissue. The top 30th terms are shown. (d and f) Percentage of the GO terms directly associated with the corresponding tissues in the top 60 terms. Percentages refer to the fractions of directly associated terms, i.e., red colored terms in (c or e), in total terms at each rank.