Figures & data
Table 1. Primer sequences used in the work.
Figure 1. Global analysis of KLF4 binding to mCpGs at enhancer regions. A. Integration of KLF4 ChIP-seq, whole-genome bisulfite sequencing and H3K27ac ChIP-seq data in human glioblastoma U87 cells. A total of 1,299 highly methylated KLF4 binding sites were found to be occupied by enhancer marks as well. B. Distribution of the 1,299 KLF4 binding sites at 10 kb upstream, 5ʹUTR, gene body, and intergenic region. Compared with all KLF4 binding sites, KLF4-mCpG binding sites associated with the H3K27ac mark were significantly enriched in gene bodies. C. Motif analysis of the KLF4-mCpG binding sequences showing location preference at either gene body or upstream/5ʹUTR region.
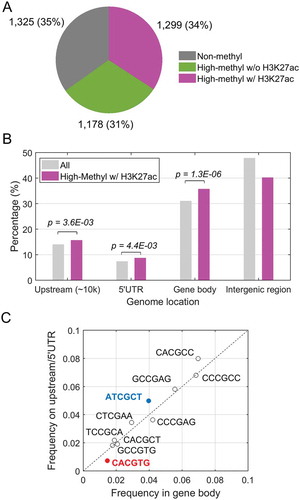
Figure 2. Proteins regulated by KLF4-mCpG interactions in U87 cells. A. U87 KLF4 WT and U87 KLF4 R458A cells were treated with Dox (1 µg/ml) for 48 h. Western blot analysis verified the induction of KLF4 WT and KLF4 R458A proteins. B. Volcano plot of differentially expressed proteins (DEPs) regulated by KLF4 WT. Protein samples were collected from untreated (WT) and Dox treated U87 KLF4 WT (Dox) cells, and subjected to mass spectrometry for protein analysis. C. Heatmap of differentially expressed proteins regulated by KLF4 WT and KLF4 R458A. In total, expression of 110 proteins was altered by KLF4 WT, but not by KLF4 R458A, out of which 73 proteins were upregulated and 37 were downregulated by KLF4 WT.
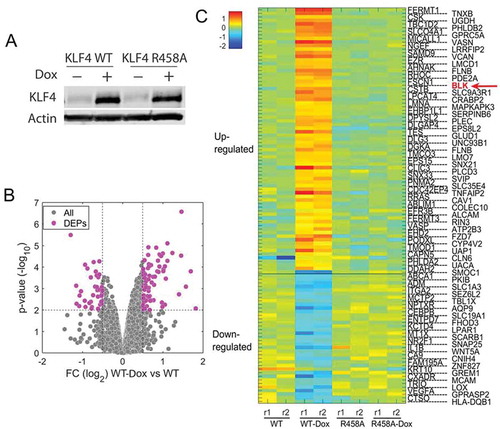
Table 2. Proteins up-regulated by KLF4-mCpG binding at the enhancer regions of the gene in human glioblastoma cells.
Figure 3. BLK was activated by KLF4 WT, not by KLF4 R458A. A. RNA-sequencing data showing that the BLK gene was only upregulated by KLF4 WT, but not by KLF4 R458A. B. Real time-PCR verified that BLK mRNA level was increased by ~2.2-fold in KLF4 WT expressing cells (P <0.05). C. Western blot analysis showed that BLK was upregulated ~3.9-fold by KLF4 WT (P <0.001), but was not changed by KLF4 R458A. Independent experiments were repeated at least three times.
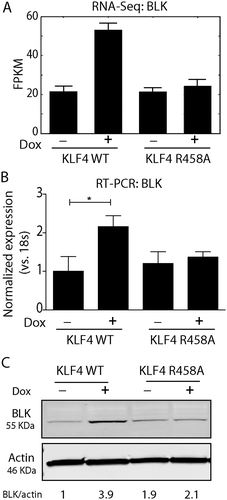
Figure 4. Chromosome conformation capture (3C) showed that KLF4 facilitated 3D chromatin loop formation. A. Hypothesized 3D structure of the BLK gene locus activation showing KLF4 binds to the 5ʹUTR and 3ʹUTR fragments of the BLK gene through a chromatin loop to activate gene expression. Primers were designed to match the 5ʹUTR and 3ʹUTR KLF4 binding sites, respectively. A PCR fragment with the size of 298 bp was predicted based on our model, even though these two binding sites are ~37 kb apart. B. 3C was performed under four conditions: U87 KLF4 WT +/- Dox and U87 KLF4 R458R +/- Dox. Cross-linked genomic DNA was fragmented by digesting with HindIII followed by ligation of adjacent fragments. Same amount of template was used for PCR to amplify the putative linked site. PCR fragment with the predicted size of 298 bp was enriched in KLF4 expressing cells. C. Quantification of the enrichment of the PCR product in U87 KLF4 WT and KLF4 R458A cells indicated a 9.2-fold increase in KLF4 WT expressing cells. D, E. Sanger sequencing confirmed that the PCR fragment 100% matched our predicted linker sequencing as shown in D. F. 5-Aza treatment in U87 KLF4 WT expressing cells prevented loop formation, and no enrichment of PCR product was detected. G. Luciferase assay of the binding activity of KLF4 to the 3ʹUTR region of the BLK locus showing ~4-fold increase in luciferase activity upon Dox treatment. For panel B, C, F, and G, independent experiments were repeated at least three times. ***: P <0.001.
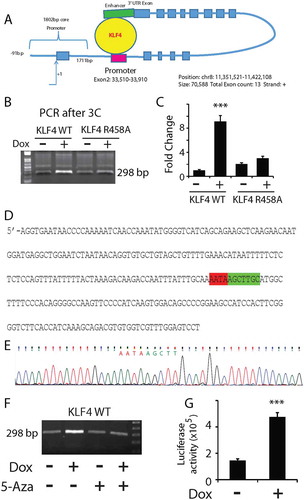
Figure 5. KLF4 bound to the enhancer region of BLK in a methylation-dependent manner to activate gene expression. A. Genomic DNA from U87 KLF4 WT and KLF4 R458A cells were immunoprecipitated by a KLF4 antibody and served as templates for PCR. The 3ʹUTR binding site of the BLK gene was only enriched in KLF4 WT-expressing cells, and not in KLF4 R458A-expressing cells. Input genomic DNA served as positive control and isogenic IgG precipitated sample as negative control. B. Bisulfite sequencing analysis indicated highly methylated CpG sites of the putative KLF4 binding region at the 3ʹUTR of the BLK gene. C. 5-Aza abolished the methyl group of the tested CpG sites at the 3ʹUTR region of the BLK gene. D. ChIP-PCR of the same 3ʹUTR region in U87 KLF4 WT cells after 5-Aza treatment. 5-Aza abolished KLF4 WT binding to this fragment. E. RT-PCR indicated that 5-Aza blocked BLK upregulation in KLF4 WT expressing cells (*: P <0.05). For panels A, D, and E, experiments were repeated at least three times.
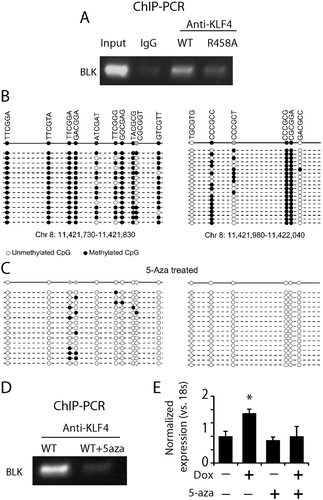
Figure 6. KLF4 bound to mCpGs at enhancer regions to activate LMO7 expression A. Schematic structure of the LMO7 gene locus showing KLF4 binding sites at the 5ʹUTR flanking exon 2 with ~10 kb apart. B. H3K27ac ChIP-seq analysis indicated the enrichment of the enhancer mark at the two KLF4 binding sites of the LMO7 gene, which are also highly methylated according to our whole-genome bisulfite sequencing data analysis (dotted). C. Primers were designed to span the two KLF4 binding sites of the LMO7 gene and to amplify the predicted linker site of the 3D loop. A predicated PCR fragments with the size of 311 bp was enriched in KLF4 WT expressing cells, but not in KLF4 R458A expressing cells. D, E. Sanger sequencing confirmed that the PCR fragment completely matched our putative loop with the linker sequencing as shown in D.
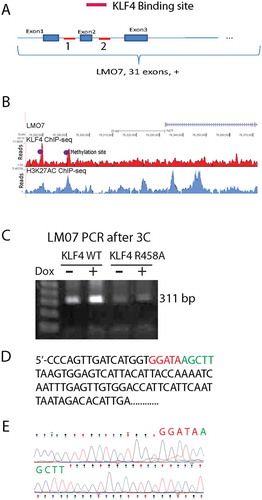
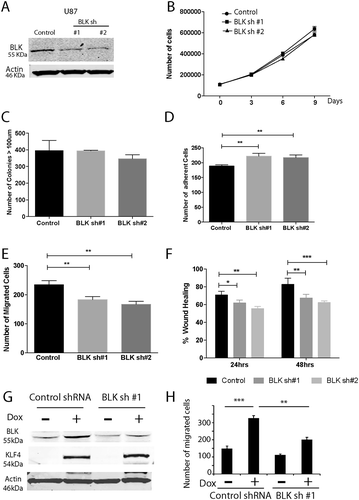
Figure 7. Biological function of BLK in GBM cells. A. GBM cells were transduced with virus containing non-silencing shRNA (Control) or BLK shRNAs. BLK was knocked down by ~80% in U87 cells with two distinct constructs of BLK shRNA (sh#1 and sh#2). B, C. BLK knockdown did not change U87 cell proliferation (B) and colony formation ability in soft agar (C). D. BLK knockdown significantly increased cell adhesion. E, F. BLK downregulation decreased cell migration in transwell assays (E) and scratch wound healing assays (F). G. BLK was knocked down in U87 KLF4 WT cells. Cells were transduced with control shRNA or BLK shRNA #1. H. Cell migration assay in U87 KLF4 WT cells with or without BLK knock down. KLF4 expression was induced by Dox. ***: P <0.001; **: P <0.01; *:P <0.05.