
Figures & data
Table 1. Differential 5mC and 5hmC in mouse blood by age.
Figure 1. Sequencing data collection and analysis workflow. Genomic DNA was isolated from matched offspring blood samples at 2 months (n = 6), 4 months (n = 6), and 10 months of age (n = 6). DNA samples were then split for separate processing steps specific to the ERRBS and HMeDIP-seq methods. All processed samples were amplified and sequenced on an Illumina HiSeq 4000 sequencer using single-end, 50 nt read length. Separate bioinformatics pipelines were used to analyze ERRBS and HMeDIP-seq data. Differentially methylated CpGs (DMCs) were compared to differentially hydroxymethylated regions (DHMRs) for regions of chromosomal overlap. Regions of overlap were then annotated and visualized in the genome browser. The Nfic gene was validated using RT-qPCR on available RNA from the blood samples.
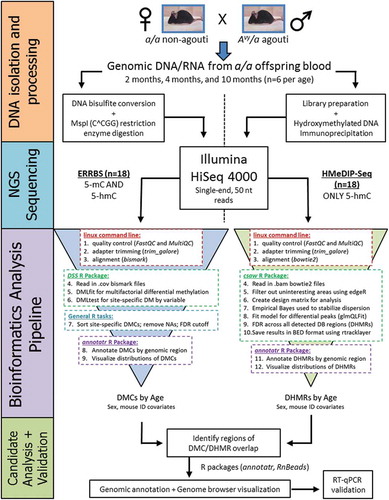
Figure 2. Venn diagrams of intersecting age-related DMCs and DHMRs by chromosomal location. The bedtools intercept function was used to test for overlap between DMCs and DHMRs by exact chromosomal location. Comparing age-related DMCs and DHMRs, we identified 65 regions that overlapped by chromosomal position. The age-related DMC and DHMR overlap sites annotated to 40 unique gene IDs. Of these 40 genes, three had multiple DMCs that overlapped a DHMR – Fbln1, Ldlrad3I, and Nfic.
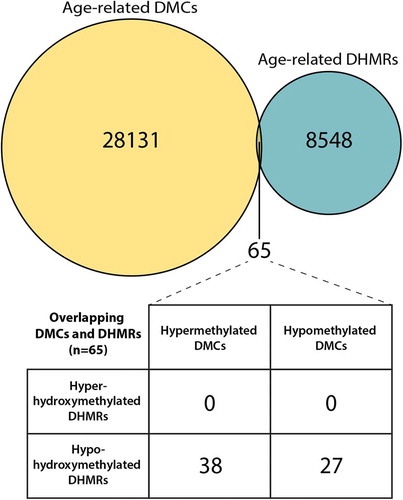
Figure 3. ERRBS, HMeDIP-seq, and RT-qPCR data for the Nfic gene DMC and DHMR overlap region. ERRBS and HMeDIP-seq data at the Nfic DMC/DHMR overlap region (chr10: 81433551–81433,800) were visualized using the Gviz, csaw, and RnBeads R packages. Of the 8,446 hypo-hydroxymethylated DHMRs, the Nfic DHMR was the 172nd most significant region (FDR = 0.0002). Y-axes show mouse ID across the three blood sample ages; sample ages are separated by horizontal lines. (a) The EERBS data show significant age-related decreases in 5mC at five CpG sites annotated to the Nfic gene, as indicated by the black box with an asterisk. Percentage DNA methylation is represented by a heatmap, with low % methylation represented by light red, and high % methylation represented by dark red; white indicates a lack of data coverage for ERRBS. A line plot comparison of 5mC across the region for all three age groups (2 months = orange, 4 months = purple, 10 months = green) is included at the bottom of the output. (b) The HMeDIP-seq data at this gene region also show a significant decrease in 5hmC peaks with age in longitudinal mouse blood samples. Blue and red peaks represent forward and reverse strand 5hmC enrichment, respectively. (c) RT-qPCR was used to measure Nfic expression levels using the 2−ΔΔCt method. There was a significant decrease in mean Nfic expression between 2 and 10 month blood samples (P = 0.04).
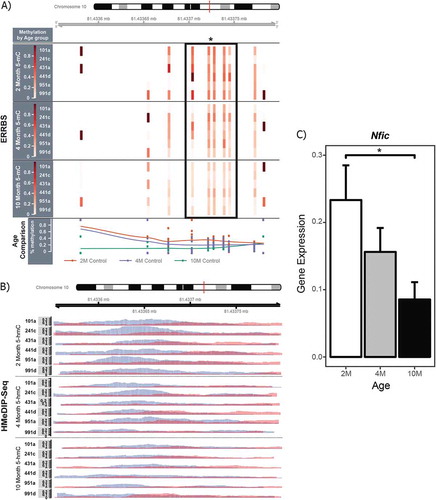
Table 2. Age-related DMCs annotated to the Esr1 locus.