
Figures & data
Table 1. The imprinting statuses of TSC lines derived from IVF or SCNT.
Figure 1. Analysis of the allelic expression and DNA methylation of placenta-specific imprinted genes in TSCs. While IVF-derived TSCs showed normal paternal expression (black arrows), SCNT-derived TSCs showed biallelic expression (red arrows). Demethylation of the Gab1 DMR consistently occurs in SCNT–TSCs while that of the Slc38a4 DMR showed a cell line-dependent difference. Open circles indicate unmethylated and filled circles indicate methylated CpG dinucleotides. Numbers in parentheses indicate the percentages of methylated CpG sites.
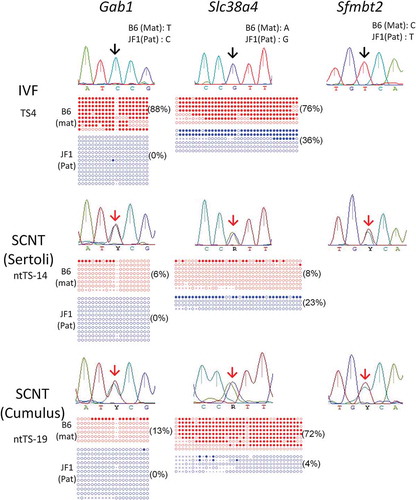
Figure 2. RT-qPCR analysis for Gab1, Slc38a4, and Sfmbt2. Four distinct IVF- and SCNT-derived TSC lines (TS-4, −5, −6, and −7; ntTS-13, −17, 18, and −19, respectively) were used. Each expression level was normalized against the level of beta-actin. Relative expression levels (mean ± standard deviation) from three independent experiments are shown. The average level of the IVF-derived lines was set as 1.0. *P < 0.01 (Student’s t-test).
Figure 3. Loss of H3K27me3 at the maternal Sfmbt2 promoter in SCNT–TSCs. (a) ChIP–qPCR analysis at the Sfmbt2 promoter. Four distinct IVF- and SCNT-derived TSC lines (TS-4, −5, −6, and −7; ntTS-13, −17, 18, and −19, respectively) were used. Enrichment of H3K27me3 was significantly decreased in all SCNT–TSC lines. Recovery efficiency (mean ± standard deviation) is shown as enrichment relative to input from three independent experiments. *P < 0.01 (Student’s t-test). (b) Allelic enrichment of H3K27me3 at the Sfmbt2 promoter. Both IVF–TSC lines (TS-4 and −5) showed maternal enrichment of H3K27me3 (black arrows), whereas there were biallelic signals in the input (red arrow). Data were obtained from three independent experiments.
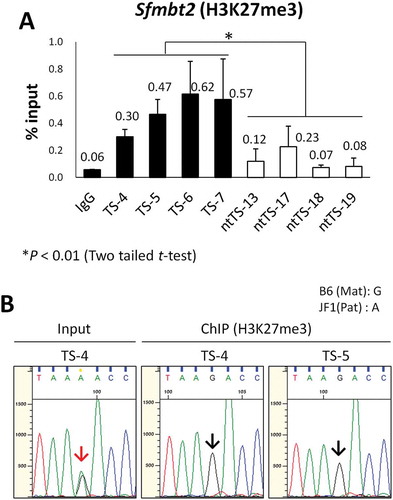
Figure 4. DNA methylation status of the IG–DMR in TSC lines derived from IVF or SCNT. SCNT–TSC lines were significantly hypermethylated at the IG–DMR (P < 0.0005, two-way ANOVA). Open circles indicate unmethylated and filled circles indicate methylated CpG dinucleotides.
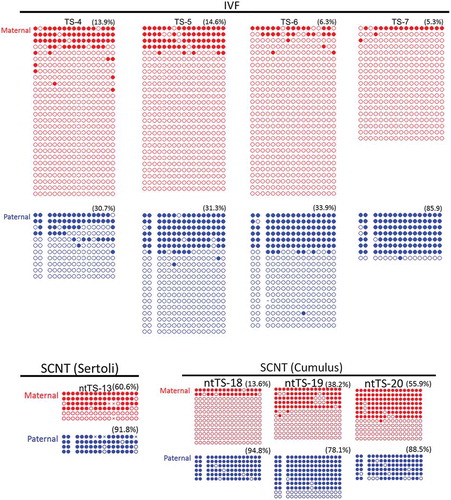
Figure 5. DNA methylation levels at the IG–DMR (paternal allele) and the major satellite region in TSC lines established using chemically defined medium (CDM) or conventional medium. (a) The protocol of TSC lines using chemically defined medium or conventional medium. The two protocols are different in the medium used at the initial stage of cell line establishment. (b) The DNA methylation levels were plotted according to data from bisulfite sequence analysis. Horizontal lines indicate mean levels. TSC lines established in chemically defined medium were prone to hypomethylation, although the IG–DMR in SCNT-derived TSC lines remained hypermethylated. *P < 0.05 (Student’s t-test). (b) Representative data from bisulfite sequence analysis. Data for the IG–DMR in TSCs established in chemically defined medium are shown in . Open circles indicate unmethylated and filled circles indicate methylated CpG dinucleotides.
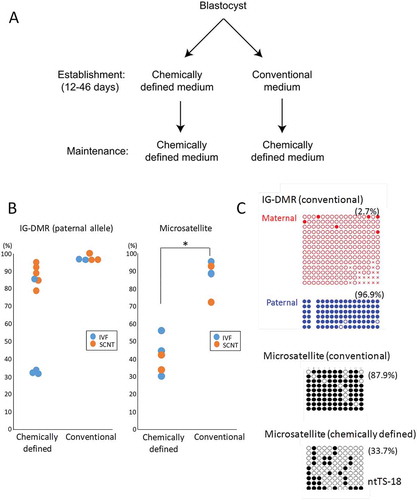
Table 2. Primer sets used in this study.