
Figures & data
Table 1. Characteristics of the ESTHER study participants at baseline according to quintiles of telomere length a.
Figure 1. Distributions of telomere length of the ESTHER study participants at baseline according to sex, age and mortality risk score.
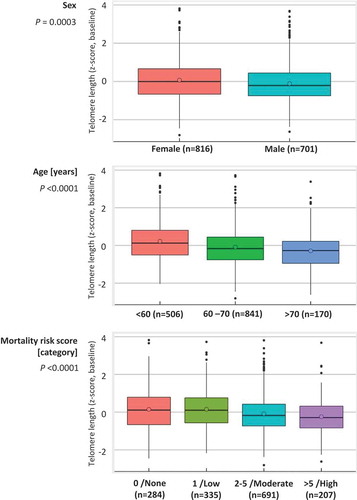
Table 2. Association of mortality risk score with telomere length (z-score) at baseline.
Figure 2. Graphs of the best-fitting models for the associations of the continuous mortality risk score with telomere length (z-score, relative & absolute).
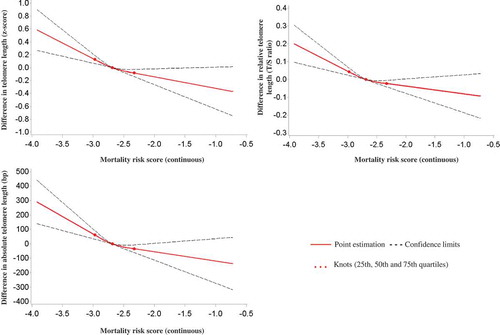
Table 3. Associations of baseline telomere length (z-score) and mortality risk score with all-cause mortality.
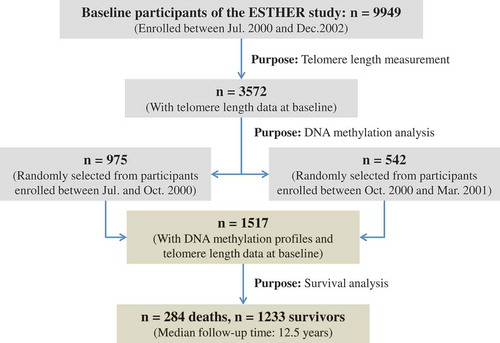
Figure 3. Overview of the sampling procedures of participants for analysis.
Supplemental material