Figures & data
Table 1. Characteristics of participants with lung function testing.
Figure 1. Genomic locations of AXL CpG sites under investigation.
Solid black box: CpG sites in the promoter region (CpG1-CpG 6); dashed gray box: CpG sites in the gene-body region (CpG 7-CpG 11); dashed black box: CpG site in the 3ʹuntranslated region (CpG 12).Cg number in parenthesis: corresponding CpG locus in HM450 array.
Table 2. Association between lung function growth and AXL promoter methylation stratified by sex in the primary study population (N = 923) and replication population (N = 237)a.
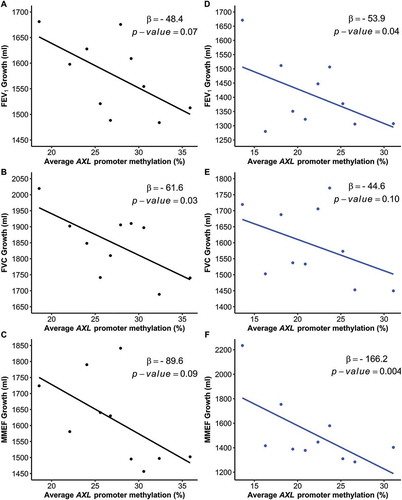
Figure 2. Mean lung function growth versus the average methylation level of AXL promoter region.
AXL promoter methylation levels were first categorized into equal-sized groups based on deciles. The mean growth in FEV1, FVC and MMEF from 10 to 18 years of age in the primary study population (Panel A-C) and 11 to 15 years of age in the replication population (Panel D-F) are plotted against the corresponding levels of methylation in each decile. The corresponding coefficients and P-values are shown.FEV1, forced expiratory volume in 1 s; FVC, forced vital capacity; MMEF, maximal midexpiratory flow rate.