
Figures & data
Table 1. Summary characteristics for 35 participants who contributed two blood samples over 1-year period.
Figure 1. (a) Scatterplot of the first two principal components (PCs) estimated from the ComBat-adjusted β-values. Each point represents an individual sample, numbered according to the subject. Two subjects, 30 and 26, are indicated in the plot to illustrate examples of subjects with low/high relative within-person variation in DNA methylation between the two time points.(b) Empirical null distribution of the average Euclidean distance between pairs of samples. Red line denotes the average within-person Euclidean distance computed across each of the n = 35 subjects.
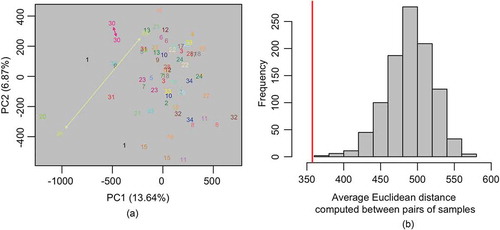
Table 2. Summary of Intraclass correlation coefficients of CpG locus methylation, for non-sex and sex chromosomes, in Beta and M scale.
Figure 2. ICC profile before and after batch effect (Combat) adjustment.
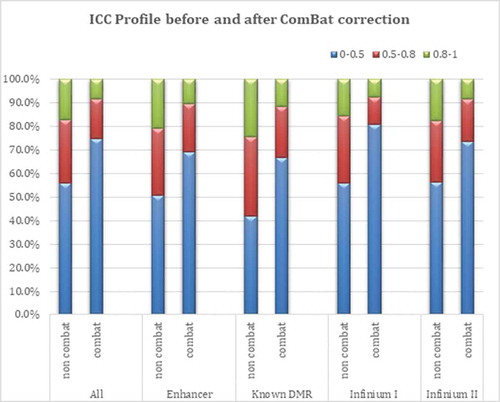
Table 3a. Summary of the ICCs of CpG locus methylation, M values, ComBat adjusted, non-sex chromosomes*.
Figure 3. ICC as a function of mean β-value.
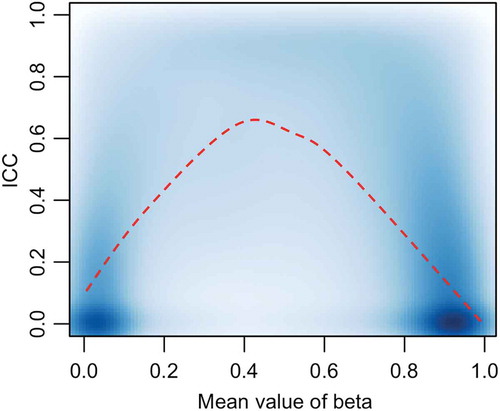
Figure 4. Distribution of hyper-stable probes by CpG Island status.
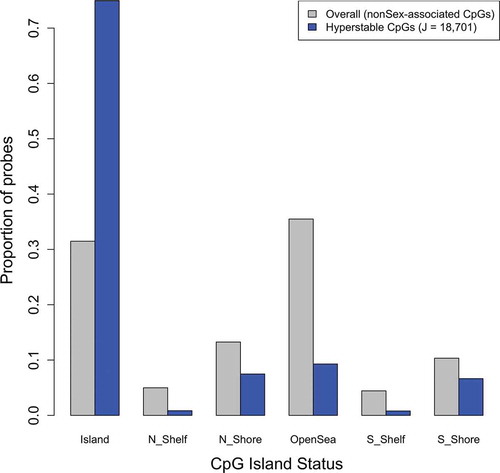
Table 3b. Summary of the intraclass correlation coefficients of CpG locus methylation, M values, ComBat adjusted, sex chromosomes*.