3,153
Views
35
CrossRef citations to date
0
Altmetric
Research paper

The role of DNA methylation in human trophoblast differentiation

ORCID Icon, ORCID Icon, ORCID Icon, ORCID Icon, ORCID Icon, , ORCID Icon, ORCID Icon, ORCID Icon & ORCID Icon show all
Pages 1154-1173 | Received 10 Jun 2018, Accepted 09 Nov 2018, Published online: 05 Dec 2018

Figures & data

Figure 1. (a) Schematic diagram of a first trimester human placental villus showing the three major mature trophoblast populations. Extravillous trophoblasts are shown invading into the decidua and remodelling a maternal spiral artery (b) Flow diagram showing the lineage differentiation pathway of trophectoderm derived trophoblast populations.

Figure 1. (a) Schematic diagram of a first trimester human placental villus showing the three major mature trophoblast populations. Extravillous trophoblasts are shown invading into the decidua and remodelling a maternal spiral artery (b) Flow diagram showing the lineage differentiation pathway of trophectoderm derived trophoblast populations.

Table 1. Table of sequenom massARRAY primers.

Table 2. Table of microRNA primers.

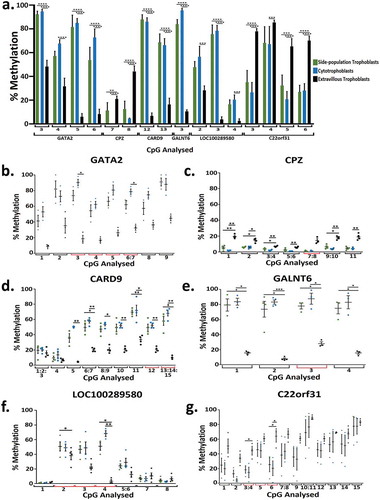
Table 3. Summary table of differential methylation between trophoblast populations.

Table 4. Table of differentially methylated genes regulating a stem cell phenotype and/or cell cycle regulation and proliferation in side-population compared to cytotrophoblasts or extravillous trophoblasts.

Table 5. Table of miRNA involved in signalling pathways regulating stem cells.

Figure 2. (a) Cluster dendogram showing hierarchical clustering based on global methylation for side-population trophoblasts (SP), cytotrophoblasts (CTB) and extravillous trophoblasts (EVT) from the four placentae used in this work (denoted by numbers 1–4). (b) Venn diagram of differentially methylated CpG sites between SP and CTB, SP and EVT or CTB and EVT.

Figure 2. (a) Cluster dendogram showing hierarchical clustering based on global methylation for side-population trophoblasts (SP), cytotrophoblasts (CTB) and extravillous trophoblasts (EVT) from the four placentae used in this work (denoted by numbers 1–4). (b) Venn diagram of differentially methylated CpG sites between SP and CTB, SP and EVT or CTB and EVT.

Figure 3. (a) Pie chart showing the mean distribution of CpGs in promoter, exon, intron and intergenic regions across all 12 trophoblast samples. b-d) Pie charts showing the percentage of differentially methylated CpG located in promoter, exon, intron and intergenic regions when (b) side-population trophoblasts (SP) are compared to cytotrophoblasts (CTB), (c) SP are compared to extravillous trophoblasts (EVT), or (d) CTB are compared to EVT.

Figure 3. (a) Pie chart showing the mean distribution of CpGs in promoter, exon, intron and intergenic regions across all 12 trophoblast samples. b-d) Pie charts showing the percentage of differentially methylated CpG located in promoter, exon, intron and intergenic regions when (b) side-population trophoblasts (SP) are compared to cytotrophoblasts (CTB), (c) SP are compared to extravillous trophoblasts (EVT), or (d) CTB are compared to EVT.

Figure 4. (a) Bar graph of the percentage methylation at 16 CpG across 6 genes that were significantly differentially methylation when analysed using RRBS and chosen for further validation using Sequenom methylation analysis in side-population trophoblasts, cytotrophoblasts and extravillous trophoblasts. Each number correlates to the CpG in the Sequenom amplicon presented in Figure 4 plots B-G. (b-g) Dot plots showing percentage methylation of CpGs in GATA2 (b), CPZ (c), CARD9 (d), GALNT6 (e), LOC100289580 (f), and C22orf31 (g) in SP, CTB, and EVT when analysed by Sequenom MassARRAY EpiTYPER Analysis. * indicates an adjusted p value ≤0.05 and ** indicates an adjusted p value ≤0.01, *** indicates an adjusted p value ≤0.001, **** indicates an adjusted p value ≤0.0001. Error bars SEM.

Figure 4. (a) Bar graph of the percentage methylation at 16 CpG across 6 genes that were significantly differentially methylation when analysed using RRBS and chosen for further validation using Sequenom methylation analysis in side-population trophoblasts, cytotrophoblasts and extravillous trophoblasts. Each number correlates to the CpG in the Sequenom amplicon presented in Figure 4 plots B-G. (b-g) Dot plots showing percentage methylation of CpGs in GATA2 (b), CPZ (c), CARD9 (d), GALNT6 (e), LOC100289580 (f), and C22orf31 (g) in SP, CTB, and EVT when analysed by Sequenom MassARRAY EpiTYPER Analysis. * indicates an adjusted p value ≤0.05 and ** indicates an adjusted p value ≤0.01, *** indicates an adjusted p value ≤0.001, **** indicates an adjusted p value ≤0.0001. Error bars SEM.

Table 6. Table of differentially methylated genes related to EMT, and/or metastatic cancers were up-regulated in extravillous trophoblasts compared to cytotrophoblasts.

Figure 5. Bar graphs showing the normalised miRNA expression in side-population trophoblasts (SP), cytotrophoblasts (CTB) or extravillous trophoblasts (EVT) for (a) miR-let-7b, (b) miR-637 and (c) miR4487. ** indicates an adjusted p value ≤0.01. Error bars are SEM.

Figure 5. Bar graphs showing the normalised miRNA expression in side-population trophoblasts (SP), cytotrophoblasts (CTB) or extravillous trophoblasts (EVT) for (a) miR-let-7b, (b) miR-637 and (c) miR4487. ** indicates an adjusted p value ≤0.01. Error bars are SEM.

Figure 6. Bar graphs showing (a) the normalised mRNA fold change in extravillous trophoblasts (EVT) compared to cytotrophoblasts (CTB) of the top 20 significantly different genes associated with EMT or invasive cancer that were hypomethylated at CpG islands in promoters regions of EVT compared to CTB (b) the normalised mRNA fold change in CTB compared to EVT of the top 20 significantly different genes that were hypermethylated at CpG island in promoters regions of CTB compared to EVT.

Figure 6. Bar graphs showing (a) the normalised mRNA fold change in extravillous trophoblasts (EVT) compared to cytotrophoblasts (CTB) of the top 20 significantly different genes associated with EMT or invasive cancer that were hypomethylated at CpG islands in promoters regions of EVT compared to CTB (b) the normalised mRNA fold change in CTB compared to EVT of the top 20 significantly different genes that were hypermethylated at CpG island in promoters regions of CTB compared to EVT.
Supplemental material

Supplemental Material

Download Zip (2 MB)

Reprints and Corporate Permissions

Please note: Selecting permissions does not provide access to the full text of the article, please see our help page How do I view content?

To request a reprint or corporate permissions for this article, please click on the relevant link below:

Academic Permissions

Please note: Selecting permissions does not provide access to the full text of the article, please see our help page How do I view content?

Obtain permissions instantly via Rightslink by clicking on the button below:

If you are unable to obtain permissions via Rightslink, please complete and submit this Permissions form. For more information, please visit our Permissions help page.