27,335
Views
136
CrossRef citations to date
0
Altmetric
Research Paper

Cannabinoid exposure and altered DNA methylation in rat and human sperm

ORCID Icon, , , , , , , , , , , , , , , , & show all
Pages 1208-1221 | Received 10 Jul 2018, Accepted 26 Nov 2018, Published online: 18 Dec 2018

Figures & data

Table 1. Participant characteristics.

Figure 1. Study procedures for screening and consent. Twenty-four men, including 12 cannabis users and 12 non-users, were enrolled and participated in the study.

Figure 1. Study procedures for screening and consent. Twenty-four men, including 12 cannabis users and 12 non-users, were enrolled and participated in the study.

Figure 2. Cannabis use is associated with DNA methylation in sperm. (a) Heat map showing DNA methylation relative to the median for 708 CpG sites (rows) associated with 46 genes with differential methylation between cannabis users (left columns) and non-user controls (right columns). Each column represents one participant, while each row represents one CpG site. Row clustering was unsupervised. Methylation levels are median-centered. (b) Top, bisulfite pyrosequencing data compared to RRBS data from users to non-users for a CpG within the intragenic repeated sequence of AHRR by linear regression. Bottom, bisulfite pyrosequencing data for one of the few genes, PRDM16, showing increased methylation in the user group. Each data point is the average of replicate measures. The mean is shown by the center dashed bar with error bars representing standard deviation. Unpaired t test, one-tailed, F test to compare variances (p = 0.44). D’Agostino & Pearson normality test showed data was normally distributed in each group. (c) Top graph: bisulfite pyrosequencing data for COL18A1 showing all eight CpG sites analyzed together discriminate users from non-users. Each data point is the average of replicate measures. The mean is shown by the center dashed bar with error bars representing standard deviation. Unpaired t test, one-tailed, F test to compare variances (p = 0.27). D’Agostino & Pearson normality test showed data was normally distributed in each group. Bottom five graphs: Comparison of methylation values from RRBS versus bisulfite pyrosequencing for the five CpG sites identified as differentially methylated by RRBS, analyzed using linear regression. (d) Top graph: bisulfite pyrosequencing data for PTPRN2 showing all seven CpG sites analyzed together discriminate users from non-users. Each data point is the average of replicate measures. The mean is shown by the center bar with error bars representing standard deviation. Unpaired t test with Welch’s correction, one-tailed, F test to compare variances (p = 0.03). D’Agostino & Pearson normality test showed data was normally distributed in each group. Bottom five graphs: Comparison of methylation values from RRBS versus bisulfite pyrosequencing for the five CpG sites identified as differentially methylated by RRBS, analyzed by linear regression. (e) Correlations between urinary THC concentration in the human cannabis user group and sperm DNA methylation levels for CpGs identified as differentially methylated in PTGIR (top) and CSNK1E (bottom), analyzed by linear regression. Panels B-D: Users, open circles; non-users, closed circles.

Figure 2. Cannabis use is associated with DNA methylation in sperm. (a) Heat map showing DNA methylation relative to the median for 708 CpG sites (rows) associated with 46 genes with differential methylation between cannabis users (left columns) and non-user controls (right columns). Each column represents one participant, while each row represents one CpG site. Row clustering was unsupervised. Methylation levels are median-centered. (b) Top, bisulfite pyrosequencing data compared to RRBS data from users to non-users for a CpG within the intragenic repeated sequence of AHRR by linear regression. Bottom, bisulfite pyrosequencing data for one of the few genes, PRDM16, showing increased methylation in the user group. Each data point is the average of replicate measures. The mean is shown by the center dashed bar with error bars representing standard deviation. Unpaired t test, one-tailed, F test to compare variances (p = 0.44). D’Agostino & Pearson normality test showed data was normally distributed in each group. (c) Top graph: bisulfite pyrosequencing data for COL18A1 showing all eight CpG sites analyzed together discriminate users from non-users. Each data point is the average of replicate measures. The mean is shown by the center dashed bar with error bars representing standard deviation. Unpaired t test, one-tailed, F test to compare variances (p = 0.27). D’Agostino & Pearson normality test showed data was normally distributed in each group. Bottom five graphs: Comparison of methylation values from RRBS versus bisulfite pyrosequencing for the five CpG sites identified as differentially methylated by RRBS, analyzed using linear regression. (d) Top graph: bisulfite pyrosequencing data for PTPRN2 showing all seven CpG sites analyzed together discriminate users from non-users. Each data point is the average of replicate measures. The mean is shown by the center bar with error bars representing standard deviation. Unpaired t test with Welch’s correction, one-tailed, F test to compare variances (p = 0.03). D’Agostino & Pearson normality test showed data was normally distributed in each group. Bottom five graphs: Comparison of methylation values from RRBS versus bisulfite pyrosequencing for the five CpG sites identified as differentially methylated by RRBS, analyzed by linear regression. (e) Correlations between urinary THC concentration in the human cannabis user group and sperm DNA methylation levels for CpGs identified as differentially methylated in PTGIR (top) and CSNK1E (bottom), analyzed by linear regression. Panels B-D: Users, open circles; non-users, closed circles.

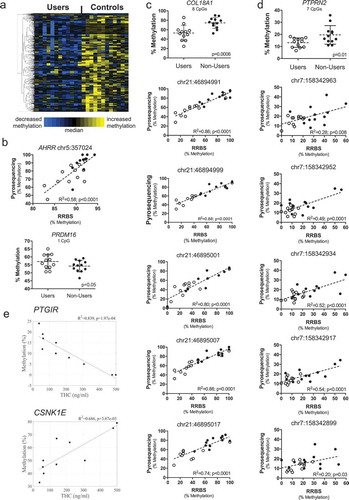
Table 2. KEGG pathways enriched with differentially methylated genes in humans and rats*.

Supplemental material

Supplemental Material

Download Zip (5.1 MB)