
Figures & data
Figure 1. Selection of ELEMENT subjects for the study1.
1Offspring from enrollment cohorts 2 and 3 were re-contacted and re-enrolled based on availability of prenatal and neonatal biospecimens. We did not re-contact Cohort 1 participants, originally recruited in 1994–96, because the majority had advanced stages or had completed pubertal development.
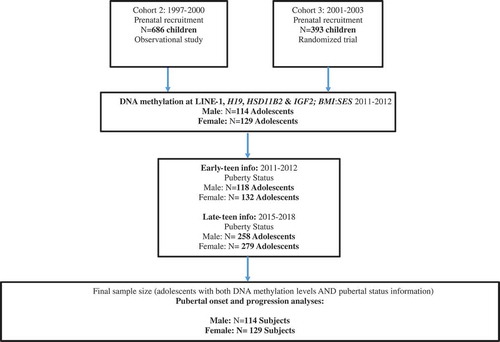
Table 1. Distributions of tanner stages and other covariates among 250 ELEMENT children at the early-teen visit (Visit 1) and again at the late-teen visit (Visit 2) for 222 children who continued follow-up.
Table 2. DNA Methylation at LINE-1, H19, HSD11B2 and IGF2 among all individuals and stratified by sexa.
Table 3. Associations between site-specific visit 1 (early-teen) DNA methylation and visit 1 (early-teen) or visit 2 (late-teen) pubertal onset, in adjusted Cox survival modela,b. CpG sites with at least one significant relationship (p < 0.05) are shown. See Supplemental Table 2 for full results.
Table 4. Associations between site-specific visit 1 (early-teen) DNA methylation and pubertal progression from visit 1 (early-teen) to visit 2 (late-teen), in adjusted multivariate regression model a,b,c. CpG sites with at least one significant relationship (p < 0.05) are shown (see Supplemental Table 3 for full results). Odds Ratios are shown from adjusted models for the main effect of DNA methylation along with the interaction between DNA methylation and time between visits.