Figures & data
Figure 1. Inoculation and harvesting of samples. (a) Illustration of field inoculation. (b) Inoculated holes filled with sawdust pre-colonized by H. parviporum. (c) Area surrounding the inoculated holes after harvesting of sawdust. The arrow indicated the necrotrophic growth of H. parviporum (d) Stem after harvesting of the area surrounding the inoculated holes. The arrow indicated the necrosis caused by fungal infection.
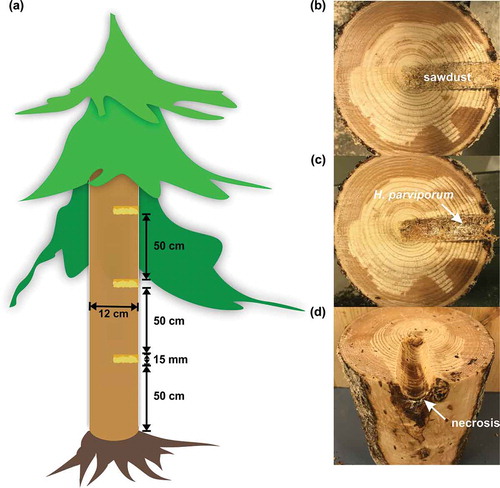
Table 1. BS-seq, RNA-seq reads and mapping to the H. parviporum reference.
Figure 2. H. parviporum DNA methylation pattern. (a) Relative proportions of mC sites in the three nucleotide contexts. R1, R2 and R3 indicated the three biological replicates of each condition. (b) Methylation density in CpG, CHG and CHH contexts. (c) Average methylation level in different functional genomic regions including TEs, 1.5 kb upstream of genes, gene, 1.0 kb downstream of genes, exons and introns. (d) Zoomed in average methylation level in gene and gene upstream till 1.5 kb and downstream till 1.0 kb. Vertical dash line represented the transcribed region of genes. Biological replicates were shown in the same color.
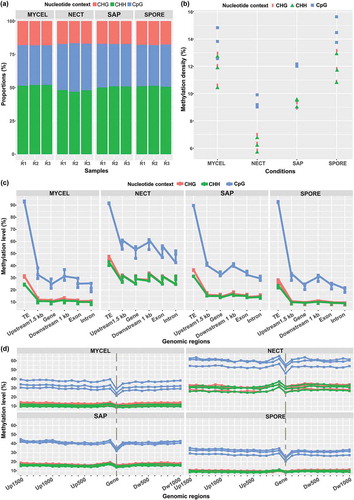
Figure 3. Distribution of DNA methylation levels in CpG, CHG and CHH contexts of all samples. Vertical dash lines represented the average methylation level in each biological replicate. The arrows denoted the average methylation level among the three biological replicates together with its standard error.
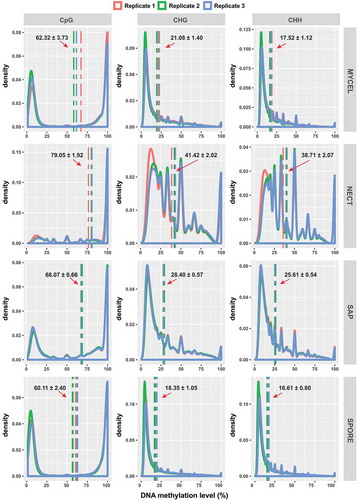
Figure 4. Genome-scale map of DNA methylation density in 10-kb windows of three biological replicates of MYCEL. Each circle from the outside to the inside depicts: (a) H. parviporum 287 scaffolds from the largest to the smallest size arranged in clockwise; (b) gene density; (c) transposable elements density; (d–f) methylation density in CpG, CHG and CHH context, respectively.
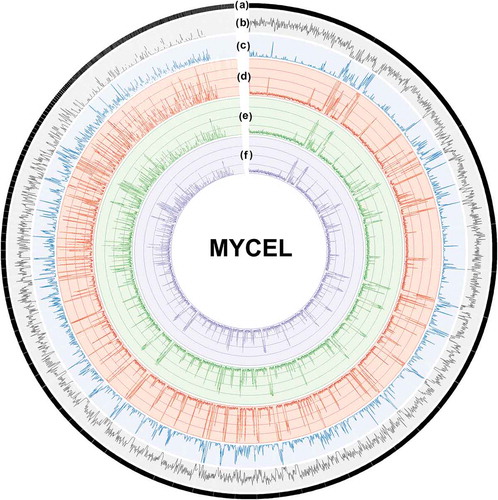
Figure 5. Selection of condition-specific genes and in planta-expressed genes. (a) Venn diagram showing the number of significantly up-regulated (unique and common) genes during mycelial growth in living trees (NECT) relative to mycelial growth in liquid media (MYCEL), sawdust (SAP) and conidiospores (SPORE). (b) Venn diagram showing the number of significantly up-regulated (unique and common) genes in SAP relative to MYCEL, NECT and SPORE. (c) Venn diagram showing the number of significantly up-regulated (unique and common) genes in SPORE relative to MYCEL, NECT and SAP. The numbers in bold red indicated the number of condition-specific genes. (d) Hierarchical clustering of condition-specific and in planta-expressed genes using their TPM values.
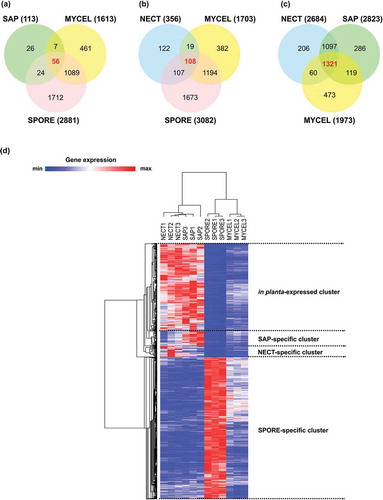
Table 2. Significantly enriched GO terms and KEGG pathways of selected gene sets.
Figure 6. Expression levels and methylation status of different classes of TEs. (a) Occurrences of predicted TEs in H. parviporum 96026 genome. (b) Barplot showing the number of expressed TEs in the studied four conditions. ‘TOTAL’ represented the total number of TEs in each subclass. The biological replicates of each condition were indicated by using the same bar color. (c) Boxplot of TEs expression level represented by Log2 TPM values in the studied conditions. (d) Barplot showing the number of methylated TEs. ‘TOTAL’ represented the total number of TEs in each subclass. The biological replicates of each condition were indicated by using the same bar color.
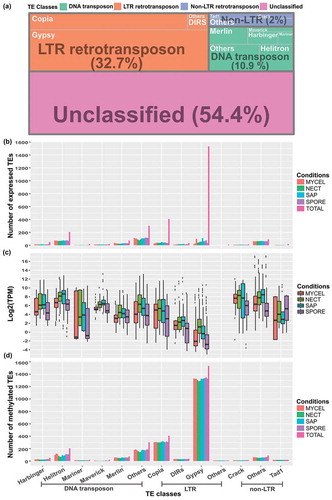
Figure 7. Association of expression level represented by Log (TPM+1) with CpG methylation levels of (a,b) transcribed region of genes and (c,d) 1.5 kb upstream of genes in the four conditions. The gene expression levels were divided into five groups. The 1st group represented the non-expressed genes, and 2nd to 5th groups included the lowest 25% to the highest 25% of expressed genes in the four conditions. Genes of all biological replicates were plotted. (e) The distribution of DNA methylation level of transcribed region of 1st group of genes (non-expressed genes). (f) The distribution of DNA methylation level of 1.5 kb upstream of 1st group of genes (non-expressed genes).
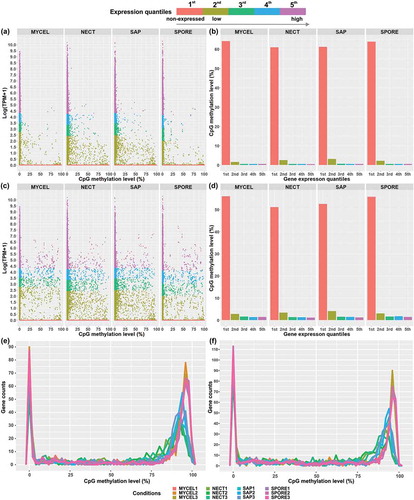
Figure 8. Examples of methylation patterns in relation to expression level under different conditions. (a) Methylation pattern I: One GMC oxidoreductase (evm.scaffold20.13) was heavily methylated in all conditions with lower methylation level and higher transcript abundances in NECT and SAP. (b) Methylation pattern II: One protein from cytochrome P450 superfamily (evm.scaffold2.271) had slightly higher methylation levels and higher transcript abundance in NECT and SAP. (c) Methylation pattern III: RNA polymerases III RPC1 subunit encoding gene (evm.scaffold29.111) had higher methylation levels and lower transcript abundance in NECT and SAP.
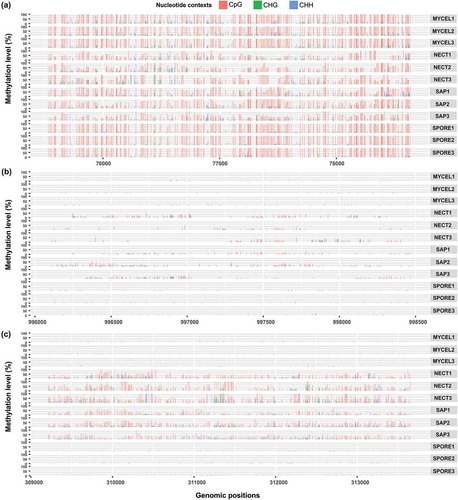
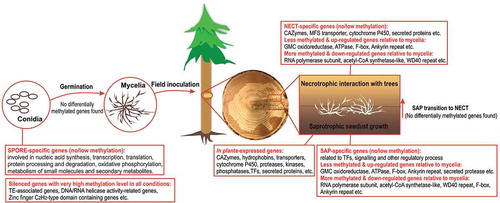
Figure 9. Summary of representative genes or biological processes in the generated gene sets of our study. All analyzed genes sets were summarized in square blocks.