Figures & data
Table 1. Characteristics of subset of Michigan PBB registry that was selected for epigenetic analysis.
Figure 1. Total PBB level is associated with DNA methylation differences genome-wide. A Manhattan plot of the association of total PBB level with DNA methylation proportion at 816,999 sites. The x-axis is the location of each site across the genome. The y-axis is the – log10 of the p-value for the association with PBB. The blue line indicates statistical significance (FDR < 0.05). 1890 CpGs had a statistically significant association with total PBB level.
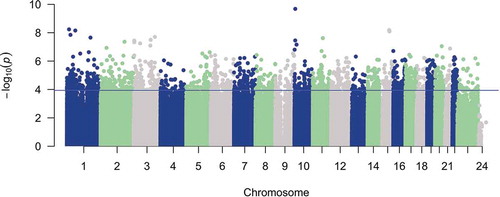
Figure 2. PBB-associated CpGs are depleted in regions near transcription start sites. Enrichment tests were conducted to determine if PBB-associated CpGs were enriched in certain regions of genes (Part A), or in certain regions of CpG island (Part B). PBB-associated CpGs are depleted in regions near transcription start sites and CpG islands, but are enriched in regions within the gene body and in the south shelf of a CpG island. * indicates statistical significance (p < 0.05).
Figure 3. PBB-associated CpGs are enriched in enhancer and insulator regions. Enrichment tests showed that PBB-associated CpGs were enriched in certain functional regions in the genome. Specifically, PBB-associated CpGs were more likely to be in enhancers regions (both strong and weak) and insulator regions, and were less likely to be in heterochromatic regions or areas near the promotors of both active and inactive genes. * indicates statistical significance (p < 0.05).
Table 2. Pathways enriched in PBB-associated eQTMs. PBB-associated CpGs associate with gene expression (eQTMs), and expression of these genes were more likely to be located in KEGG pathways implicated in immune function and autoimmune disorders (FDR < 0.05).
Figure 4. PBB-associated CpGs are more likely to be CpGs linked to expression. PBB-associated CpGs were more likely to be eQTMs than expected by chance (identified in blood in two datasets: GTP and MESA). * indicates statistical significance (p < 0.05).