Figures & data
Table 1. Numbers of differentially and common peaks after exposure to 0.5Gy and 2Gy.
Figure 1. Relative distribution of 5-hmC peaks with respect to genomic features (a). Comparative visualization of the percentage of DNA hydroxymethylation peaks in irradiated (six hours after exposure to 0.5 Gy and 2 Gy) and non-irradiated samples. (b). Degree of DNA hydroxymethylation within 3 kb around transcription start sites (TSS) indicated by read count frequency. In close vicinity to TSS a low read count frequency of hydroxymethylated peaks could be found. 95% confidence interval is represented by opaque lines. Results for other time-points were similar (data not shown).
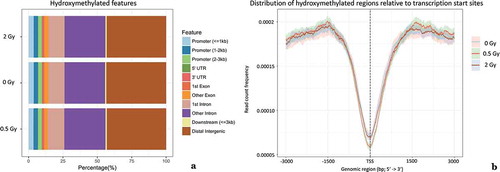
Figure 2. Distribution of differential hydroxymethylation in genic and intergenic regions over time.
(a) relative frequencies of differential hydroxymethylation peaks in samples exposed to 0.5Gy and 2 Gy, respectively, in comparison to differential peaks present in corresponding sham irradiated controls for time-points 1 h, 6 h, 24 h and 120 h after exposure. (b) detailed view of differential peak frequencies for time-point 120h after exposure (* < 0.05; ** < 0.01; *** < 0.001; representing significance levels for comparison to matching sham control.)
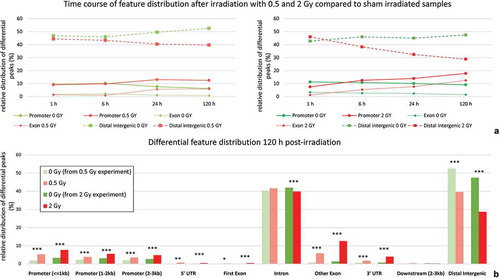
Figure 3. Overrepresentation analysis of CpG islands and CTCF binding sites within the set of differential 5-hmC peaks. See Methods for details.
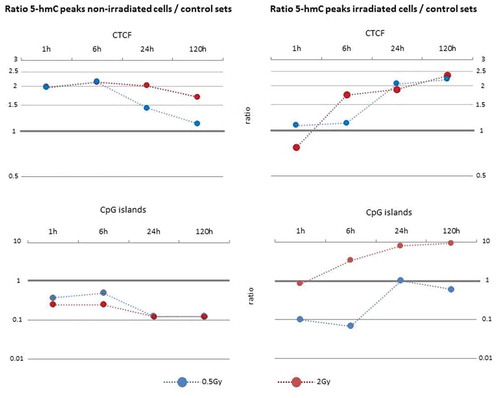
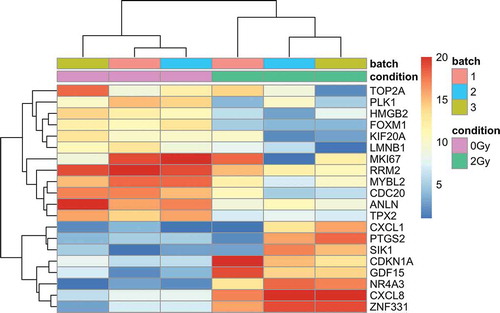
Figure 4. Hierarchical clustering of 20 genes with highest inter-sample variance of gene expression 24h after exposure to 2Gy. Replicate (batch) and condition (0 and 2Gy) are indicated on top. Coloring of gene expression status based on normalized read counts by means of DESeq2.