Figures & data
Figure 1. Temporal pattern of EZH2 expression during preimplantation development. (a) Immunofluorescence detection of EZH2. Upper panels show EZH2 staining at different stages of development, lower panels show presence of nucleus as detected by Hoechst staining. The experiment was performed 3 times and at least 20 oocytes/embryos were analyzed for each experiment. Similar results were obtained for each experiment and representative images are shown. (b) Immunoblot detection of EZH2. At least 50 oocytes/embryos were used for each lane, and experiment was conducted 3 times. TUBA was used as loading control. Similar results were obtained for each experiment and shown is a representative immunoblot. (c) Immunoblot showing rapid accumulation of EZH2 during oocyte maturation. GV, GV-intact oocyte; MI, metaphase I oocyte; MII, metaphase II arrested oocyte; 1C, 1-cell embryo; 2C, 2-cell embryo; 4C, 4-cell embryo; 8C, 8-cell embryo; BL, blastocyst stage embryo.
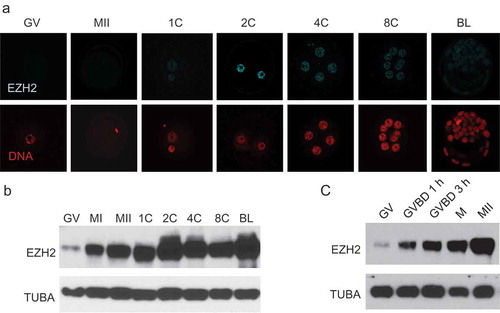
Figure 2. Knockdown of EZH2 with siRNA/morpholino in parthenotes. (a) Immunofluorescence detection of EZH2 in 2-cell parthenotes. Upper panels show EZH2 staining, lower panels show presence of nucleus as detected by Hoechst staining. The experiment was performed 3 times and at least 20 oocytes/eggs/embryos were analyzed for each experiment. Similar results were obtained for each experiment and representative images are shown. (b) Immunoblot detection of EZH2 through oocyte maturation (left blot) and at the 2-cell parthenote embryo stage (right blot). Control si/morpho indicates injection of control siRNA/morpholino at the GV stage and Ezh2 si/morpho indicates injection of the siRNA/morpholino at the GV stage. TUBA was used as a loading control. (c) Immunocytochemical detection of H3K27me3 (top panels) and H3K9me3 (middle panels) in 2-cell parthenotes. Bottom panels show presence of nucleus as detected by Hoechst staining. The experiment was performed 3 times and at least 20 oocytes/eggs/embryos were analyzed for each experiment. Similar results were obtained for each experiment and representative images are shown. (d) Quantification of data shown in panel C. Asterisk represents significant (p < 0.05) decrease from control to EZH2 knockdown parthenotes (EZH2 KD). (e) Effect of EZH2 KD on development. Y-axis shows percentage of parthenotes that reached each given stage. Asterisk represents significant (p < 0.05) decrease compared to control. The experiment was performed 3 times and at least 20 oocytes/eggs/embryos were used for each group. Abbreviations as in with M representing morula.
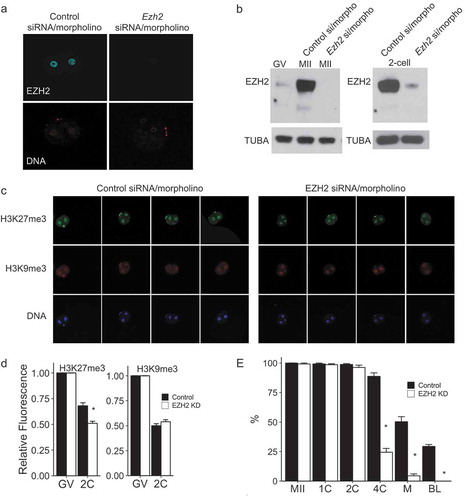
Figure 3. Effect of GSK343 treatment on H3K27me3 and H3K9me3 in parthenotes. (a) Immunofluorescence detection of H3K27me3 (top panels) and H3K9me3 (middle panels) in 2-cell parthenogenetic embryos. Bottom panels show presence of nucleus as detected by Hoechst staining. The experiment was performed 3 times and at least 20 oocytes/embryos were analyzed for each experiment. Similar results were obtained for each experiment and representative images are shown. (b) Quantification of data shown in panel A. Asterisk represents significant (p < 0.05) decrease compared to control. GV, GV-intact oocyte; 2C, 2-cell embryo.
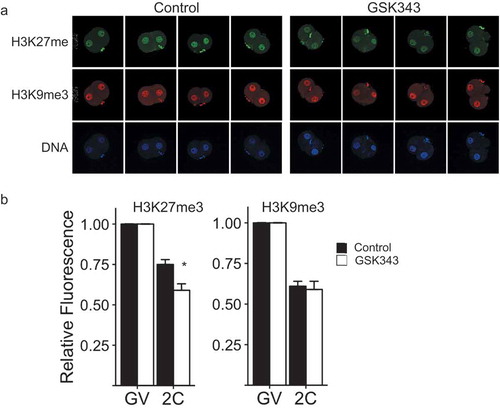
Figure 4. Summary of data of effect of different GSK343 treatments on development. Orange boxes indicate the presence of 5 µM GSK343 in culture media. Size of embryo represents percentage of parthenotes obtained following in vitro maturation and activation that developed to that stage for that treatment. Each experiment was performed 3 times and at least 20 oocytes/embryos were analyzed for each experiment. See Table S1 for data. GV, GV-intact oocyte; MII, metaphase II-arrested egg.
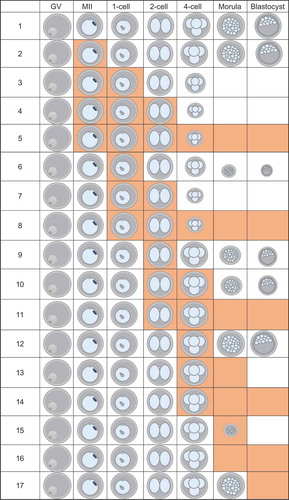
Figure 5. Effect of GSK343 treatment on biparental embryo development, and H3K27me3 and H3K9me3 of in vivo matured and in vitro fertilized embryos. (a) Summary of data of effect of different GSK343 treatments on development. Orange boxes indicate the presence of 5 µM GSK343 in culture media. Size of embryo represents percentage of embryos that developed to that stage given that treatment. Each experiment was performed 3 times and at least 20 oocytes/embryos were analyzed for each experiment. See Table S4 for data. (b) Immunofluorescence detection of H3K27me3 (top panels) and H3K9me3 (middle panels) in 2-cell biparental embryos. Bottom panels show presence of nucleus as detected by Hoechst staining. The experiment was performed 3 times and at least 20 oocytes/embryos were analyzed for each experiment. Similar results were obtained for each experiment and representative images are shown. (c) Quantification of data shown in panel B. Asterisk represents significant (p < 0.05) decrease compared to control. GV, GV-intact oocyte; MII, metaphase II-arrested egg; 2C, 2-cell embryo.
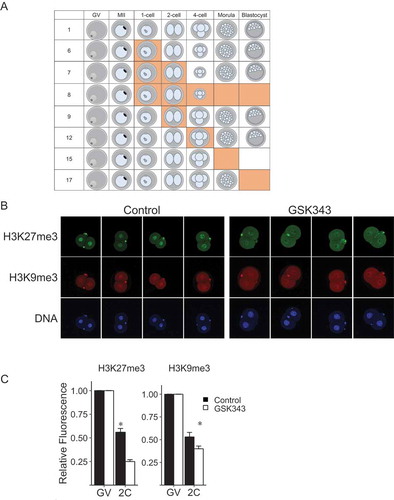
Figure 6. Effect of GSK343 on global transcription. Biparental embryos (Fertilized) were fertilized in vivo and parthenotes (PA) were in vivo matured and parthenogenetically activated. Both groups were cultured in control medium or medium containing GSK343 or α-amanitin. EU incorporation was assayed in 2-cell embryos. The experiment was performed 3 times, and at least 20 embryos were analyzed for each experiment. Asterisk represents significant (p < 0.05) decrease from control.
Figure 7. Effect of GSK343 treatment on transcriptome. RNA-seq was conducted using 2-cell biparental embryos that were in vivo fertilized or parthenotes that were in vivo matured and parthenogenetically activated. Both groups were then cultured in control medium or medium containing GSK343 or α-amanitin. (a) Principal component analysis (PCA). Four replicates were performed, and at least 20 embryos were used for each sample. The graph was created using CLC Genomics Workbench (CLC Bio, Denmark). (b) Venn diagram comparison of transcripts whose relative abundance was decreased (FDR p-value<0.05) in parthenotes treated with GSK343 or α-amanitin compared to parthenotes cultured in control media.
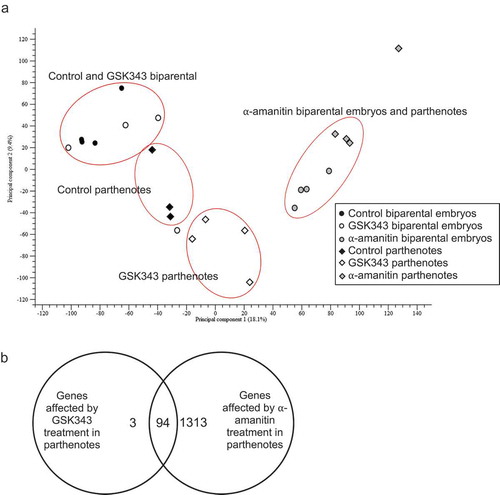
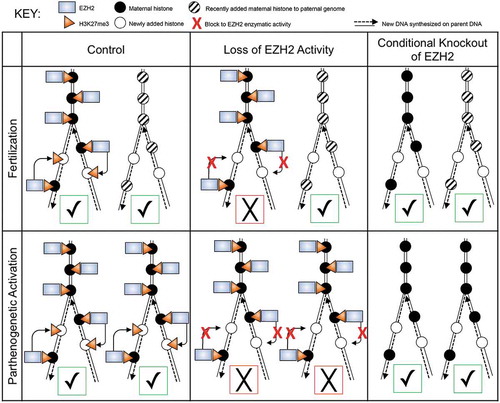
Figure 8. Schematic diagram depicting effect of inhibiting EZH2 function on propagation of H3K27me3 mark in diploid parthenotes and biparental embryos during DNA replication. Top row represents biparental embryos and bottom row diplodized parthenotes, with maternal chromosomes on the left and paternal chromosomes on the right in each box. Black circles represent maternal histones deposited on maternal chromosomes during oocyte growth, whereas striped circles represent histones that are deposited onto the paternal genome after fertilization and lack the mark, which appears in the late 1-cell stage and following initial formation of H3K27me1 and 2. Empty circles represent histones that are deposited during DNA replication. In the ‘Control’ column (far left), EZH2 (blue rectangle) is present and able to propagate the maternal H3K27me3 mark (orange triangle) onto newly deposited histones during DNA replication of maternal chromosomes. In contrast, paternal chromosomes will remain devoid of the mark. In the ‘Loss of EZH2 Activity’ column (center), the enzymatic activity of EZH2 is inhibited (red X) due to GSK343 treatment. Therefore the maternal H3K27me3 mark fails to be propagated onto newly deposited histones on maternal chromosomes and the mark fails to appear on replicated paternal chromosomes. In the ‘Conditional Knockout of EZH2’ column (far right), maternal EZH2 is not present, leading to loss of H3K27me3 on maternal chromosomes as well as on paternal chromosomes. For parthenotes, the maternal H3K27me3 mark is not maintained following DNA replication when EZH2 is inhibited. In contrast, depleting maternal EZH2 results in maternal chromosomes not harboring the mark and therefore the chromosomes fail to acquire the mark following activation and DNA replication. Check marks in green squares represent ‘successful’ and X’s in red squares represent ‘unsuccessful’ with respect to inheriting the initial epigenetic ground-state in the zygote across DNA replication. The results suggest that development to the blastocyst stage requires at least one of the parental genomes maintain the epigenetic landscape present in the zygote prior to DNA replication.