Figures & data
Table 1. Selected baseline characteristics of study population (n = 360) mother-offspring pairs), Newborn Epigenetics STudy (NEST).
Table 2. Top 20 genes with differentially methylated CpGs in offspring cord blood associated with maternal obesity before and after adjustment for cell proportions, among females (n = 187).
Table 3. Top 20 genes with differentially methylated CpGs in offspring cord blood associated with maternal obesity before and after adjustment for cell proportions, among males (n = 173).
Table 4. Associationsa of TAPBP DNA methylation sitesb with child BMI z-score and elevated blood pressure at 4–5 years of age, among 238 female and male offspring in NEST cohort.
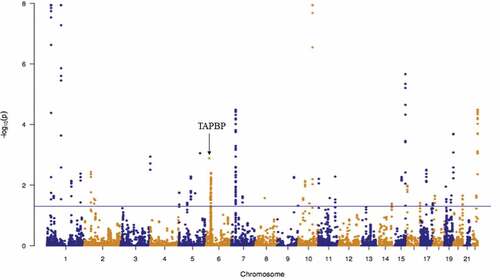
Figure 1. Manhattan plot for the associations between maternal pre-pregnancy obesity and offspring cord blood DNA methylation among females (n = 187) after adjustment for estimated cell proportions. A total of 876 CpGs had an FDR-adjusted P-value <0.05 (solid horizontal blue line).
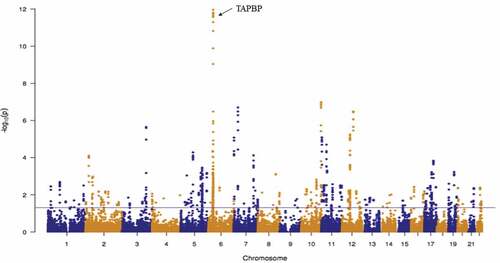
Figure 2. Manhattan plot for the associations between maternal pre-pregnancy obesity and offspring cord blood DNA methylation among males (n = 173) after adjustment for estimated cell proportions. A total of 293 CpGs had an FDR-adjusted P-value <0.05 (solid horizontal blue line).