Figures & data
Figure 1. Reduced MNase digestibility at potential transcriptional regulatory regions in KO (Lsh-/-) compared to WT (Lsh+/+) MEFs (a). MNase digestion followed by agarose gel electrophoresis in MEFs derived from two Lsh-/- (KO) embryos and two wild type (Lsh+/+) controls for isolation of mono-and di-nucleosomal DNA. (b). Genome browser view of normalized read density of WT and KO samples. The arrows at the bottom indicate the direction of the two depicted genes. (c). Bar graph representing average read density at 4kb region around TSS, 5’_TSS, random sites, Lsh binding sites, DNase I hypersensitivity sites of B cells, DNase sites of liver, transcription factor E2F1, Brd3, and Elk1. ** p value<0.01, NS, not significant, p > 0.05. (d). Intensity Plot of MNase-seq signal enrichment around TSS sites (e). Intensity Plot of MNase-seq signal enrichment around TES sites (f). Profiles of MNase-seq signal enrichment at Rad21 binding sites and 2000bp flanking region upstream and downstream. WT (blue), KO (red).
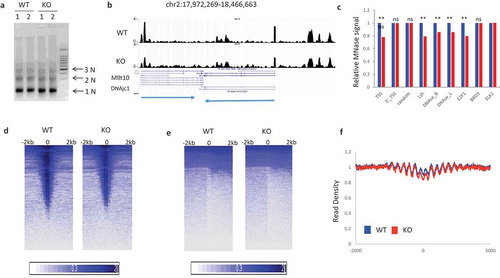
Figure 2. Chromatin accessibility changes after Lsh depletion occur without DNA methylation changes (a). Graph of conditional Lsh MEFs (flox/flox) containing a tamoxifen (OHT) inducible cre-recombinase transgene which were treated in vitro with tamoxifen. (b). Western analysis for Lsh protein detection after 48 hours of tamoxifen treatment with biological replicates. (c). Graph of auxin inducible Lsh proteolytic degradation system. Lsh (orange) is tagged with degron (yellow) which allows association with Tir1 E3 ligase (blue) after auxin (IAA) addition, followed by ubiquitination and degradation. (d). Western analysis for Lsh protein detection after auxin (IAA) addition at indicated time points. (e). Elisa assay for detection of global DNA methylation without (IAA-0hr) and with (IAA-72hrs) IAA treatment, or without (OHT-0hr) and with (OHT-48hr) tamoxifen treatment. KO MEFs derived from day13.5 Lsh-/- embryos and WT MEFs derived from Lsh+/+ embryos serve as controls. * p value<0.01, NS, not significant, p > 0.05. (f). LC-Mass spectrometry for detection of global DNA methylation without (IAA-0hr) and with IAA treatment (IAA-72hrs), or without (OHT-0hr) and with tamoxifen treatment (OHT-48hr). (g). Bisulfite sequencing analysis for DNA methylation detection at 11 sites of the Pcdha8 gene for MEFs without (IAA-0hr) and with (IAA-72hrs) IAA treatment. (h). Profiles of MNase-seq signal enrichment at Rad21 binding sites and 2000bp upstream and downstream flanking regions. MEFs were untreated (0h) or treated for 72 hours (72h) with auxin for deletion of Lsh. (i-k). Mean read densities in a region comprising −100bp to +100bp around Rad21 binding sites are plotted as box-whisker plot. ** p-value < 0.002 (Wilcoxon signed rank test with continuity correction). MEFs without (IAA_0h) or with seven hours of auxin treatment (IAA_7h), or without (OHT_0h) and with 48 hours of tamoxifen treatment (OHT_48h), or derived from wild type embryo (WT) or Lsh-/- embryo (KO). ** p-value< 0.002.
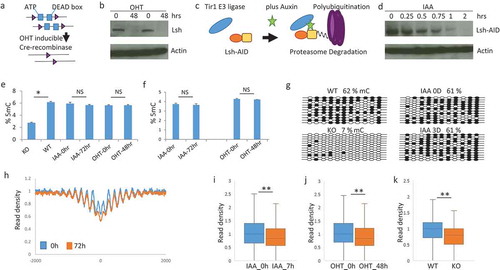
Figure 3. Characterization of genomic regions with MNase digestibility changes in dependence of Lsh (a). Bar graph presentation to illustrate relative enrichment (positive scale) or relative depletion (Negative scale) of Down Peaks (black, lower MNase signal density in the absence of Lsh) and Up Peaks (blue, greater MNase signal density in the absence of Lsh) at genomic features, including 3UTR, other, RNA, miRNA, ncRNA, TTS, Line, snpRNA, Sine, RC, tRNA, DNA, Exon, Intron, Intergenic, promoter, 5UTR, snoRNA, scRNA, CpG island, Low complexity regions, LTR, sample repeats, snRNA, satellites, and tRNA. (b). Bar graph presentation to illustrate the distribution of down peaks (black) and up peaks (blue) at known genomic location expressed as percentage. (c). Motif analysis for Down Peaks (lower MNase signal density in the absence of Lsh) and Up Peaks (greater MNase signal density in the absence of Lsh). Q-value (Benjamini).
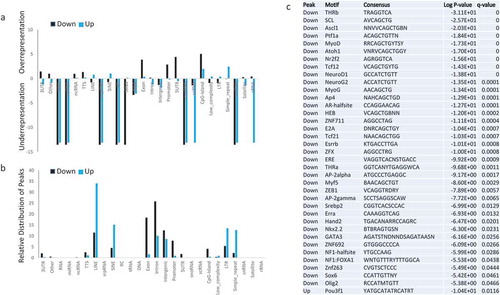
Figure 4. Chromatin accessibility changes at transcription factor binding sites and potential enhancer regions (a). Profiles of mean MNase-seq signal enrichment without (blue) and with 48h of Lsh deletion (orange) induced by tamoxifen (OHT) treatment at Pft1a, Atoh1, MyoD and NeuroD1 binding sites and 2000 bp of upstream and downstream flanking regions. (b). MNase profiles without (blue) and with 72h of Lsh deletion (red) induced by auxin (IAA) treatment at Pft1a, Atoh1, Myod1 and Neorod1 binding sites and 2000 bp of upstream and downstream flanking regions. (c). MNase profiles without (blue) and with 72h of Lsh deletion (red) induced by auxin (IAA) treatment at potential enhancer regions identified by DNase I treatment in B cells or mammary gland cells or identified by H3K27ac enrichment in adipose tissue or by H3K4me1 enrichment in myoblasts and 2000 bp of upstream and downstream flanking regions. * p-value< 0.002.
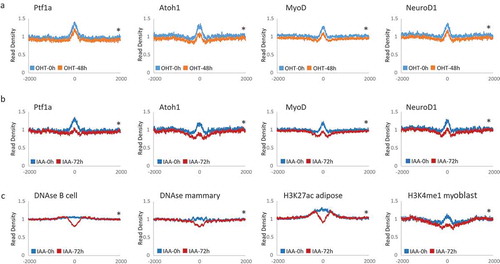
Figure 5. Increased chromatin accessibility and reduced H3 retention at liver specific transcription factor binding sites. (a-d). Profiles of mean MNase-seq signal enrichment without (blue) and with three days (3D) of Lsh deletion (red) induced by auxin (IAA) treatment at DNase I hypersensitivity sites in liver (a), Hnf4a (b), Cebpb (c) and FoxA2 (d) binding sites and 2000 bp of upstream and downstream flanking regions. Wilcoxon signed-rank test, * p-value< 0.002 (e). ChIPs analysis using anti-H3 or IgG control at Foxa2 and Hnf4a binding sites of the indicated genes in MEFs without (OHT-0D) and with (OHT-3D) three days of tamoxifen treatment for depletion of Lsh. NC1, NC2, NC3 sites do not show changes in chromatin accessibility and serve as control sites. AFP Alpha-Fetoprotein, Trf Transferrin, Alb Albumin, Apob Apolipoprotein B, Pim3 proviral integration site 3, Mast3 microtubule associated serine/threonine kinase 3, Alkbh8 AlkB homolog 8, Desi1 Desumoylating isopeptidase 1, Decr2 2,4-Dienoyl-CoA Reductase. ChIPs results represent the mean ± SD of three independent experiments. SD: standard deviation.* p-value< 0.01 (f). Western analysis for detection of Lsh, Hnf4a, Foxa2 and actin (control) protein expression in MEFs without (OHT-) and with (OHT+) three days of tamoxifen treatment for depletion of Lsh, and without (Dox-) and with (Dox+) two days of doxycycline treatment for induction of the liver specific transcription factors Foxa2 and Hnf4a. (g). Bisulfite sequencing analysis for detection of DNA methylation at four sites (AFP, Trf, Pim3 and Mast3 genes). Genomic DNA was derived from MEFs without (IAA-0D) and with (IAA-3D) auxin treatment or from MEFs derived of Lsh-/- (KO) or Lsh+/+ (WT) embryos, serving as controls.
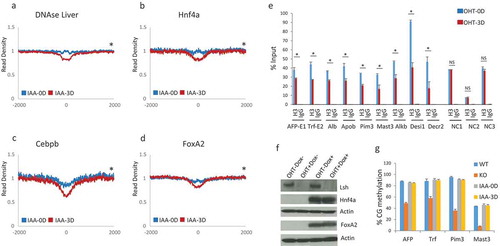
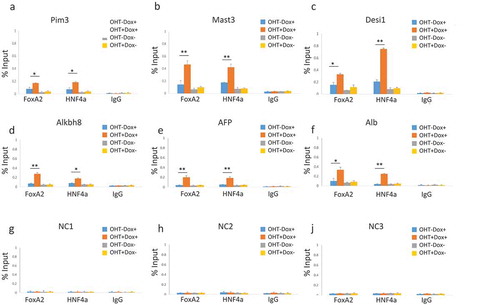
Figure 6. Increased occupancy of exogenously expressed transcription factors at sites of increased chromatin accessibility. ChIPs analysis using anti-Foxa2, anti-Hnf4a or IgG control for detection of Foxa2 and Hnf4a at indicated genes, as examined in ). MEFs without (OHT-) and with (OHT+) three days of tamoxifen treatment for depletion of Lsh, and without (Dox-) and with (Dox+) two days of doxycycline treatment for induction of the liver specific transcription factors Foxa2 and Hnf4a. (a). Pim3 proviral integration site 3. (b). Mast3 microtubule associated serine/threonine kinase 3. (c). Desi1 Desumoylating isopeptidase 1. (d). Alkbh8 AlkB homolog 8. (e). AFP Alpha-Fetoprotein. (f). Alb Albumin. (g). – I. NC1, NC2, NC3 sites do not show changes in chromatin accessibility and serve as control sites, as in ). ApoB, Decr2 and Trf are shown in supplement Figure S7. ChIPs results represent the mean ± SD of three independent experiments. SD: standard deviation. *P < 0.05; **P < 0.01.