
Figures & data
Figure 1. Effect of exercise on global DNA methylation (a) and mRNA expression of DNMT1 (b), DNMT3a (c) and DNMT3b (d). Data presented as the mean value of all trials for each time point. * p < 0.05, # p < 0.01.
Figure 2. The impact of supplementation of n-3 PUFA and EVOO on global DNA methylation (a) and mRNA expression of DNMT1 (b), DNMT3a (c) and DNMT3b (d). Data presented as the relative change (Δ) between pre and post supplementation trials (post supplementation – pre supplementation) for each supplement. n-3 PUFA, n-3 polyunsaturated fatty acid; EVOO, extra virgin olive oil. * p < 0.05.
Figure 3. Effect of exercise on DNA methylation of CpG-260 (a) and mRNA expression (b) of PPARGC1A. Data presented as the mean value of all trials for each time point. # p < 0.01.
Figure 4. The impact of n-3 PUFA and EVOO supplementation on IL6 CpG3 DNA methylation (a) and IL6 mRNA expression (b). Data presented as the change (Δ) between pre and post supplementation trials (post supplementation – pre supplementation). n-3 PUFA, n-3 polyunsaturated fatty acid; EVOO, extra virgin olive oil. * p < 0.05.
Figure 5. Spearman’s Rho correlation coefficients between mean DNA methylation values and gene expression values across all conditions (supplement, time and trial). The mean of all CpG sites assessed for each gene has been used to provide an overall view of the region of interest. Blue indicates a negative correlation, red indicates a positive correlation and black indicates correlation coefficients between −0.5 and 0.5. * p < 0.05, # p < 0.01.
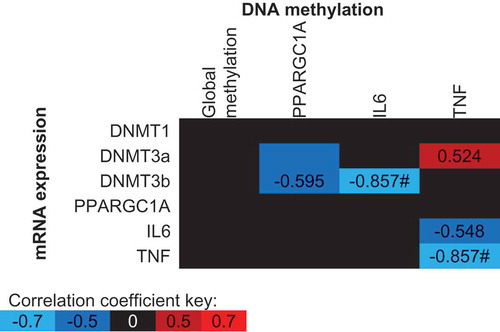
Figure 6. Spearman’s Rho between post-exercise DNA methylation and physiological markers related to exercise performance, oxidative stress and inflammation. The mean of all CpG sites assessed for each gene has been used to provide an overall view of the region of interest. Blue indicates a negative correlation, red indicates a positive correlation and black indicates correlation coefficients between −0.5 and 0.5. n-3 PUFA, omega-3 polyunsaturated fatty acid; EVOO, extra virgin olive oil; TT, Time trial; PC, protein carbonyl. *p < 0.05, # p < 0.01.
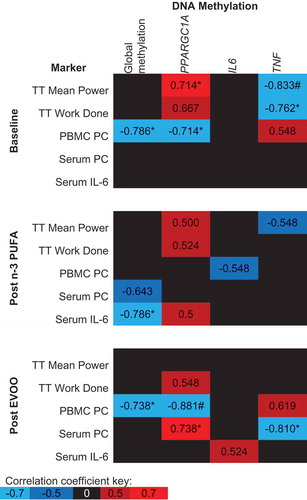
Table 1. Participant characteristics. Wmax, maximal aerobic work rate.
Figure 7. Schematic representation of study outline (a) and trial day (b). n-3 PUFA, omega-3 polyunsaturated fatty acid; EVOO, extra virgin olive oil; Wmax, maximal aerobic work rate.
Table 2. Details of pyrosequencing assays used to determine DNA methylation. Genomic location identified using genome reference consortium human build 38 patch release 12. CpG sites are indicated in the sequence to analyze by Y. For, forward primer; Rev, reverse primer, Seq, sequencing primer; TSS, transcription start site; bp, base pair.
Table 3. ` Details of assays used to determine mRNA expression. For, forward primer; Rev, reverse primer; bp, base pairs.