
Figures & data
Table 1. Summary of differentially methylated CpG sites in whole blood and different cell types.
Table 2. pSLE-specific DNAm signature.
Figure 1. PCA of the DNA methylation dataset in all 145 samples.
Each dot represents the DNAm data from one patient sample, either from whole blood or one of the purified lineages. (a) PCA of the raw DNAm data showed that samples clustered according to their cell type but not disease manifestation, indicating a strong cell type-specific DNA methylation signature. (b) PCA using the pSLE-specific DNAm signature showed that samples can be distinguished based on both disease group and cell lineage.
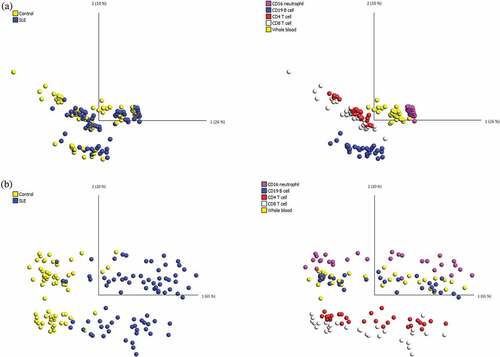
Figure 2. Venn diagram showing differentially methylated CpG sites across different cell lineages.
The diagram shows the overlap between the differentially methylated CpG sites identified in CD4 + T cells, CD8 + T cells, B cells, neutrophils and whole blood in pSLE. (a) No CpG sites showed differential gain of DNA methylation in any cell type. (b) A total of 21 CpG sites showed differential loss of DNA methylation in all cell types.
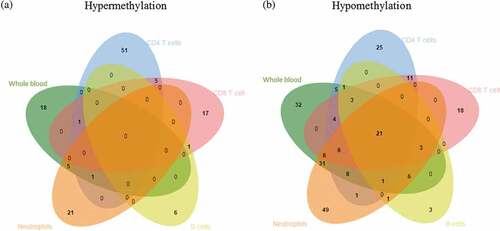
Figure 3. Heatmap of the pSLE-specific DNAm signature.
Unsupervised hierarchical clustering using the pSLE-specific DNAm signature showed that samples were first separated according to disease manifestation, followed by cell lineage. Hierarchical clustering was performed using Euclidian distance metrics.
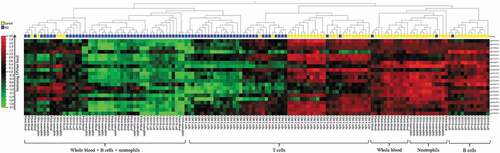
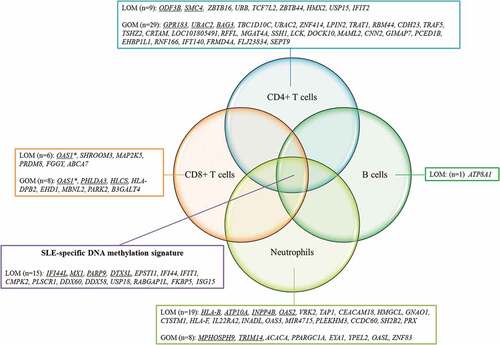
Figure 4. Lineage-specific DNAm changes in pSLE patients.
The diagram shows the similarities and differences between the differentially methylated genes identified in CD4 + T cells, CD8 + T cells, B cells and neutrophils in pSLE. Genes showing lineage-specific DNAm changes in pSLE are shown, and genes with multiple probes showing differential methylation changes are underlined.*Both differential hypomethylation and hypermethylation were found in OAS1LOM: loss of DNAm; GOM: gain of DNAm
Supplemental material