
Figures & data
Figure 1. R2 of the 169 samples. The x-axis represents the sample index from 1 to 169, and the y-axis represents the CpG-wise R2 of the 169 samples. The red line represents the CpG-wise R2 of measured methylation beta values in the cord blood and measured methylation beta values in the placenta, and the purple line represents the CpG-wise R2 of measured methylation beta values in the placenta and predicted methylation beta values in the placenta by single-CpG-based SVM and leave-one-out cross-validation.
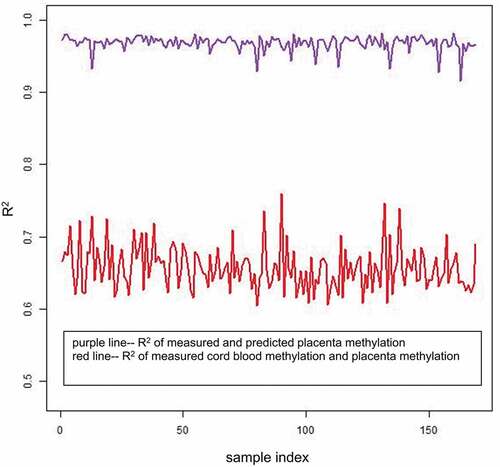
Figure 2. Methylation pattern across tissues and the between-tissue differences across individuals. (2a). Red circles indicate measured placenta beta values vs. measured cord blood beta values (x = measured placenta beta values, y = measured cord blood beta values), and purple circles indicate measured placenta beta values vs. SVM predicted placenta beta values (x = measured placenta beta values, y = predicted placenta beta values by single-CpG-based SVM and leave-one-out cross-validation). R2(raw) = CpG-wise R2 between measured methylation beta values in the placenta and measured methylation beta values in the cord blood. R2(svm) = CpG-wise R2 between measured methylation beta values in the placenta and predicted methylation beta values in the placenta by single-CpG-based SVM and leave-one-out cross-validation.
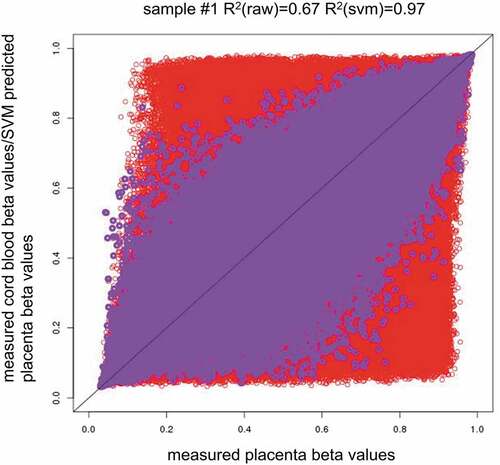
Figure 2b. Red circles indicate measured placenta beta values–measured cord blood beta values of sample #1 vs. measured placenta beta values–measured cord blood beta values of sample #2(x = measured placenta beta values–measured cord blood beta values of sample #1, y = measured placenta beta values–measured cord blood beta values of sample #2). Purple circles indicate measured placenta beta values–SVM predicted placenta beta values in sample #1 vs. measured placenta beta values–SVM predicted placenta beta values in sample #2(x = measured placenta beta values–SVM predicted placenta beta values of sample #1, y = measured placenta beta values–SVM predicted placenta beta values of sample #2). Note: ‘–’ represents minus sign.
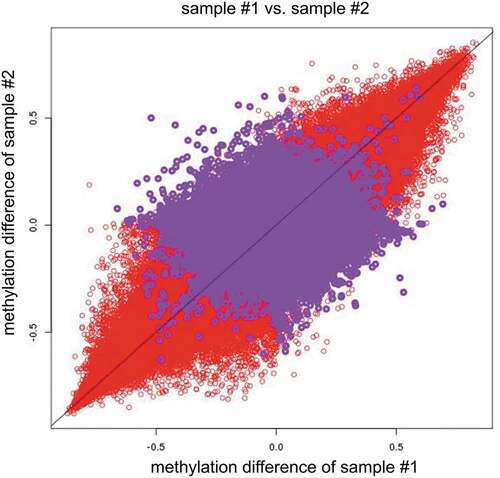
Table 1. CpG-wise R2 in different tissue pairs.
Figure 3. Relationship between R2 and mean absolute error. The y-axis is the sample-wise mean absolute error (MAE) of measured placenta methylation beta values and predicted placenta methylation beta values by single-CpG-based SVM and leave-one-out cross-validation, and the x-axis is the sample-wise R2 of measured placenta methylation beta values and predicted placenta methylation beta values by single-CpG-based SVM and leave-one-out cross-validation (CpGs with SD > 0.1).
Table 2. Mean R2 using the twofold and threefold cross-validation methods.
Figure 4. Effect of sample size on prediction accuracy. The x-axis is the sample size of the training dataset, and the y-axis is the mean of CpG-wise R2 for measured placenta methylation beta values and predicted placenta methylation beta values by single-CpG-based SVM for 100 testing samples. For the blue line, the extreme CpG sites with a minimum methylation beta value >0.8 or a maximum beta value <0.2 were removed.
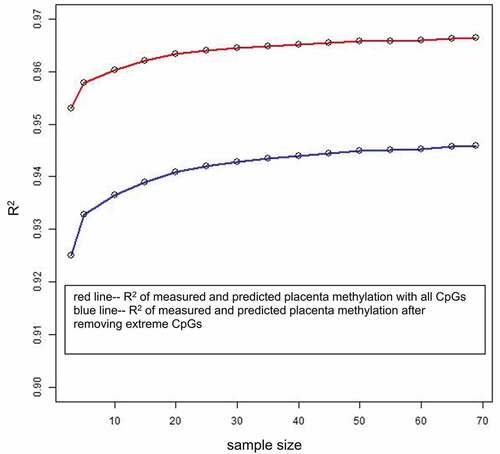
Figure 5. Venn diagram of well-predicted CpGs across the three datasets. The numbers in the circle represent the well-predicted CpGs (sample-wise R2 > 0.8) in the three datasets, and the Venn diagram shows the intersection of the well-predicted CpGs across the following three datasets: cord blood–placenta, blood–artery and blood–atrium.
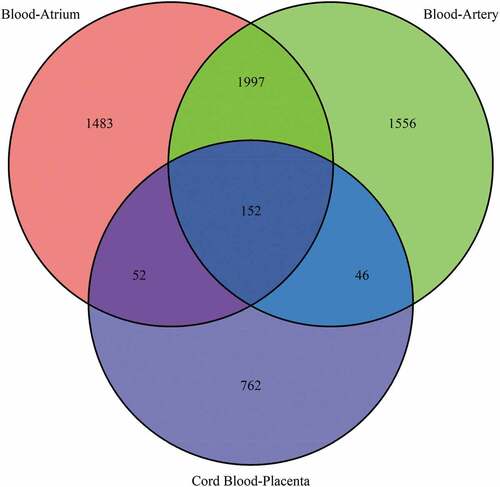
Table 3. CpG island-related distributions.